Performance
Performance charts are valid for Adour Mk.102 engines, which equipped the Jaguar A and early Jaguar GR1 versions. British Jaguar was later upgraded to Mk.104 engines, around 10% more powerful.
Performance charts are presented with various “drag indexes”. This index represents the effect of the carriage of external stores on performance. Each store has a numerical drag index value proportional to its drag coefficient, the total drag index value for a particular configuration being the sum of the individual values.
Please note that each drag index value represents the installed drag of store including its suspension equipment (pylon).
| Item | Drag index |
|---|---|
| Clean aircraft | 5 |
| Empty pylon | 2 |
| 1,200 litre external tank | 11 |
| Magic missile | 5 |
| AS37 missile | 10 |
| 1,000 lb bomb | 8 |
| 2 x 1,000 lb bomb (in tandem) | 13 |
| BL755 cluster bomb | 9 |
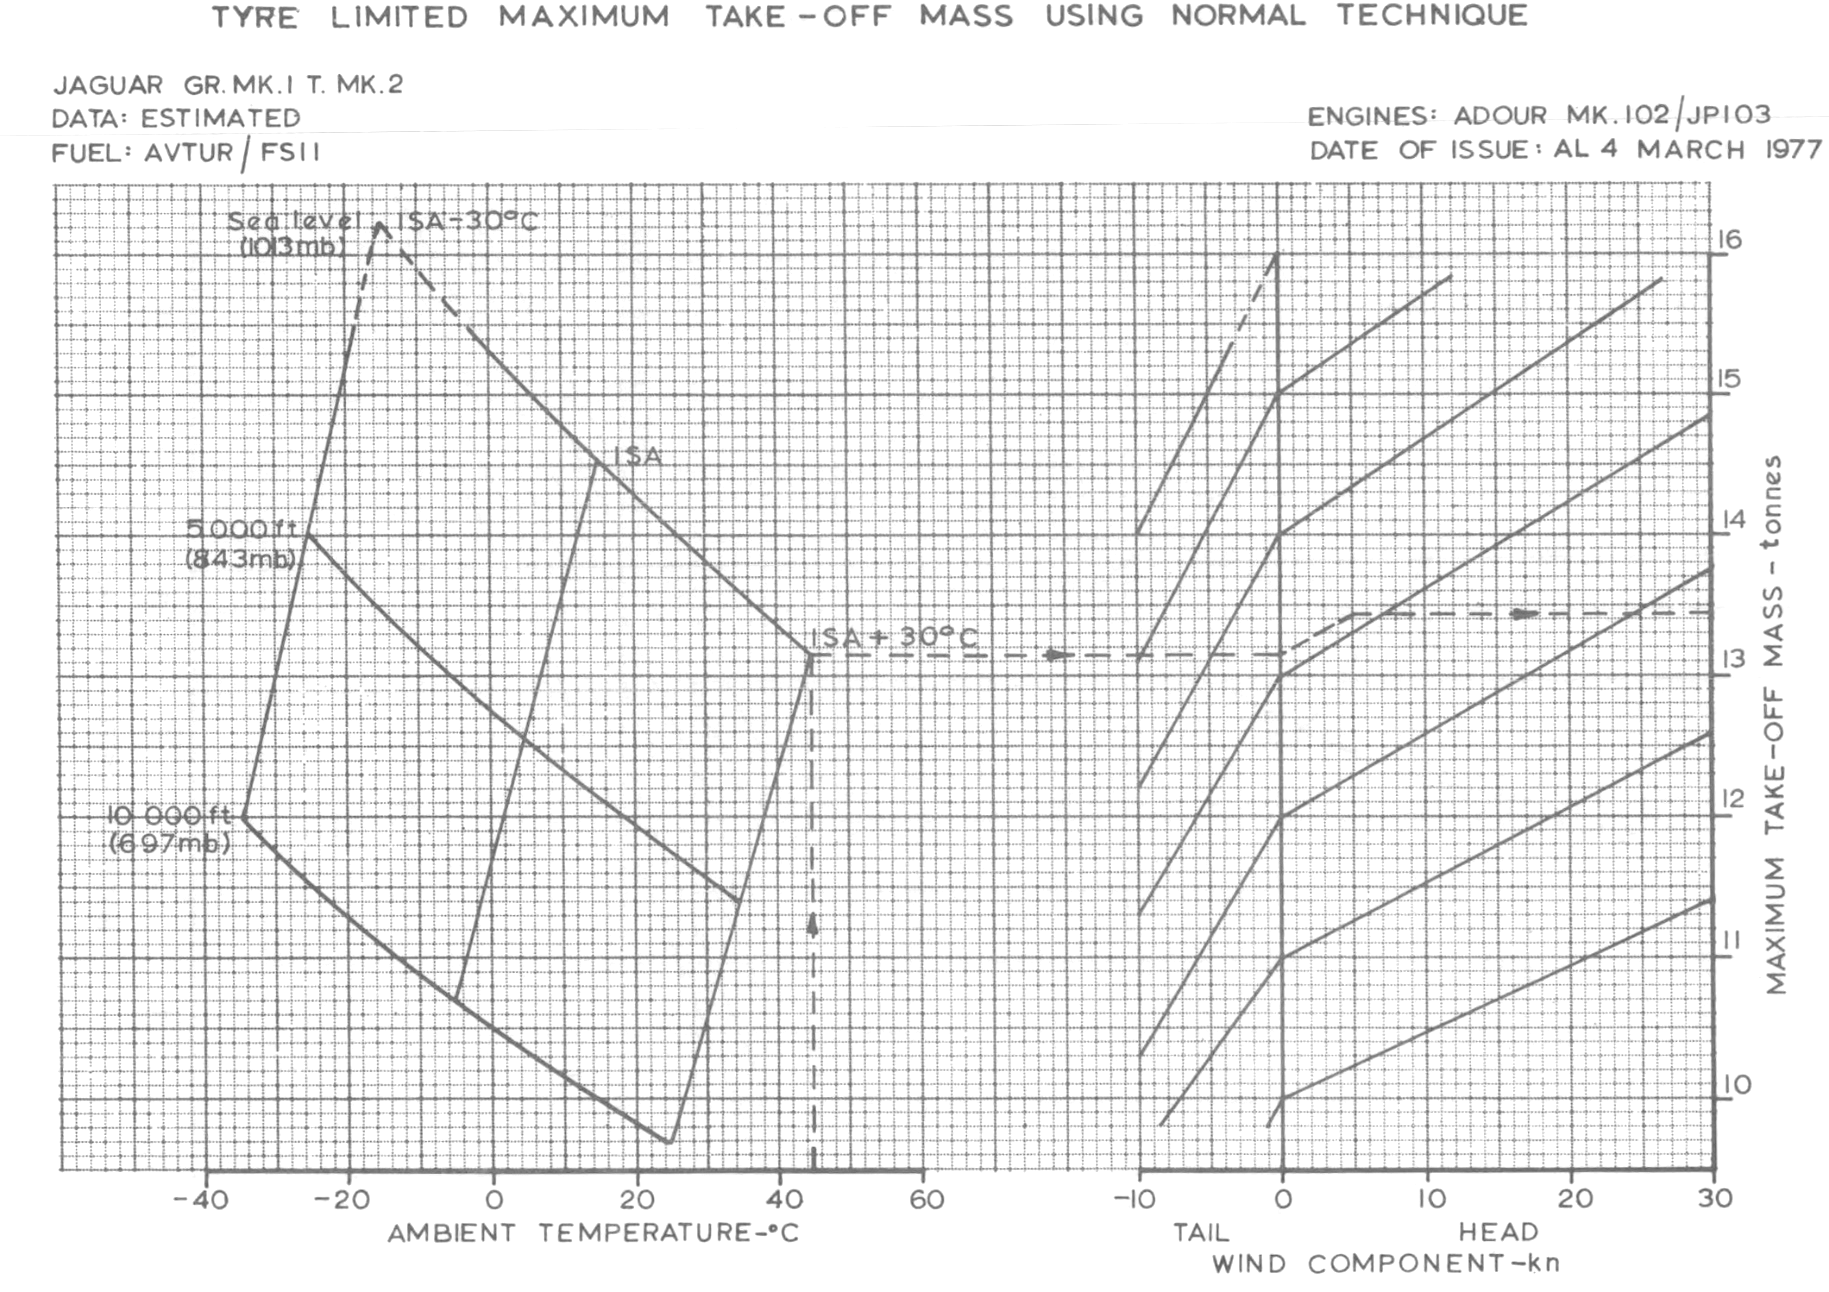
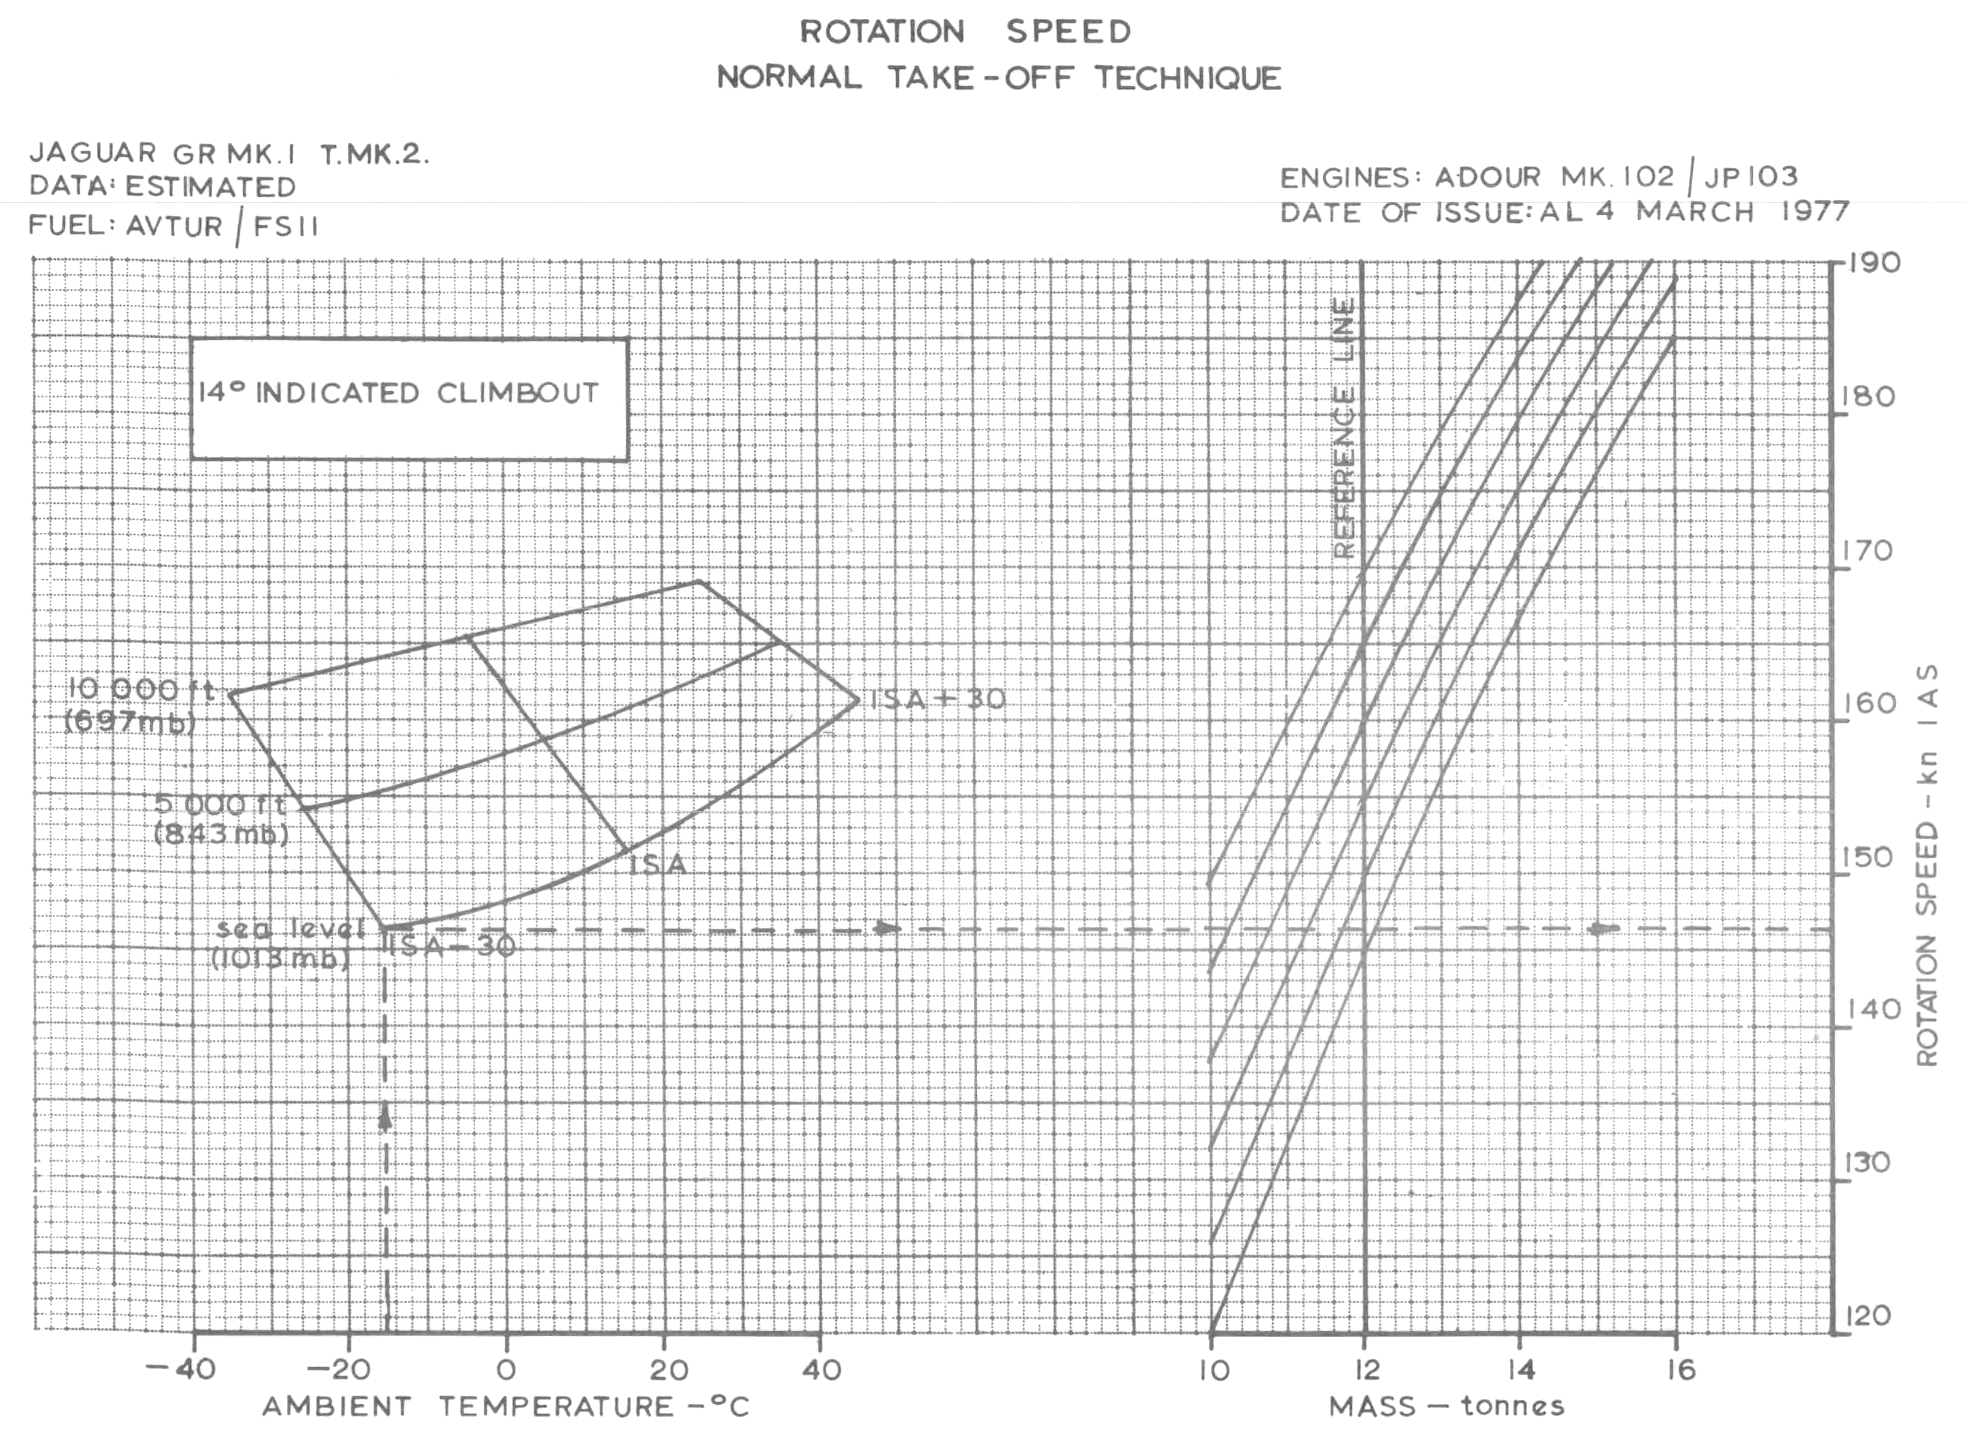
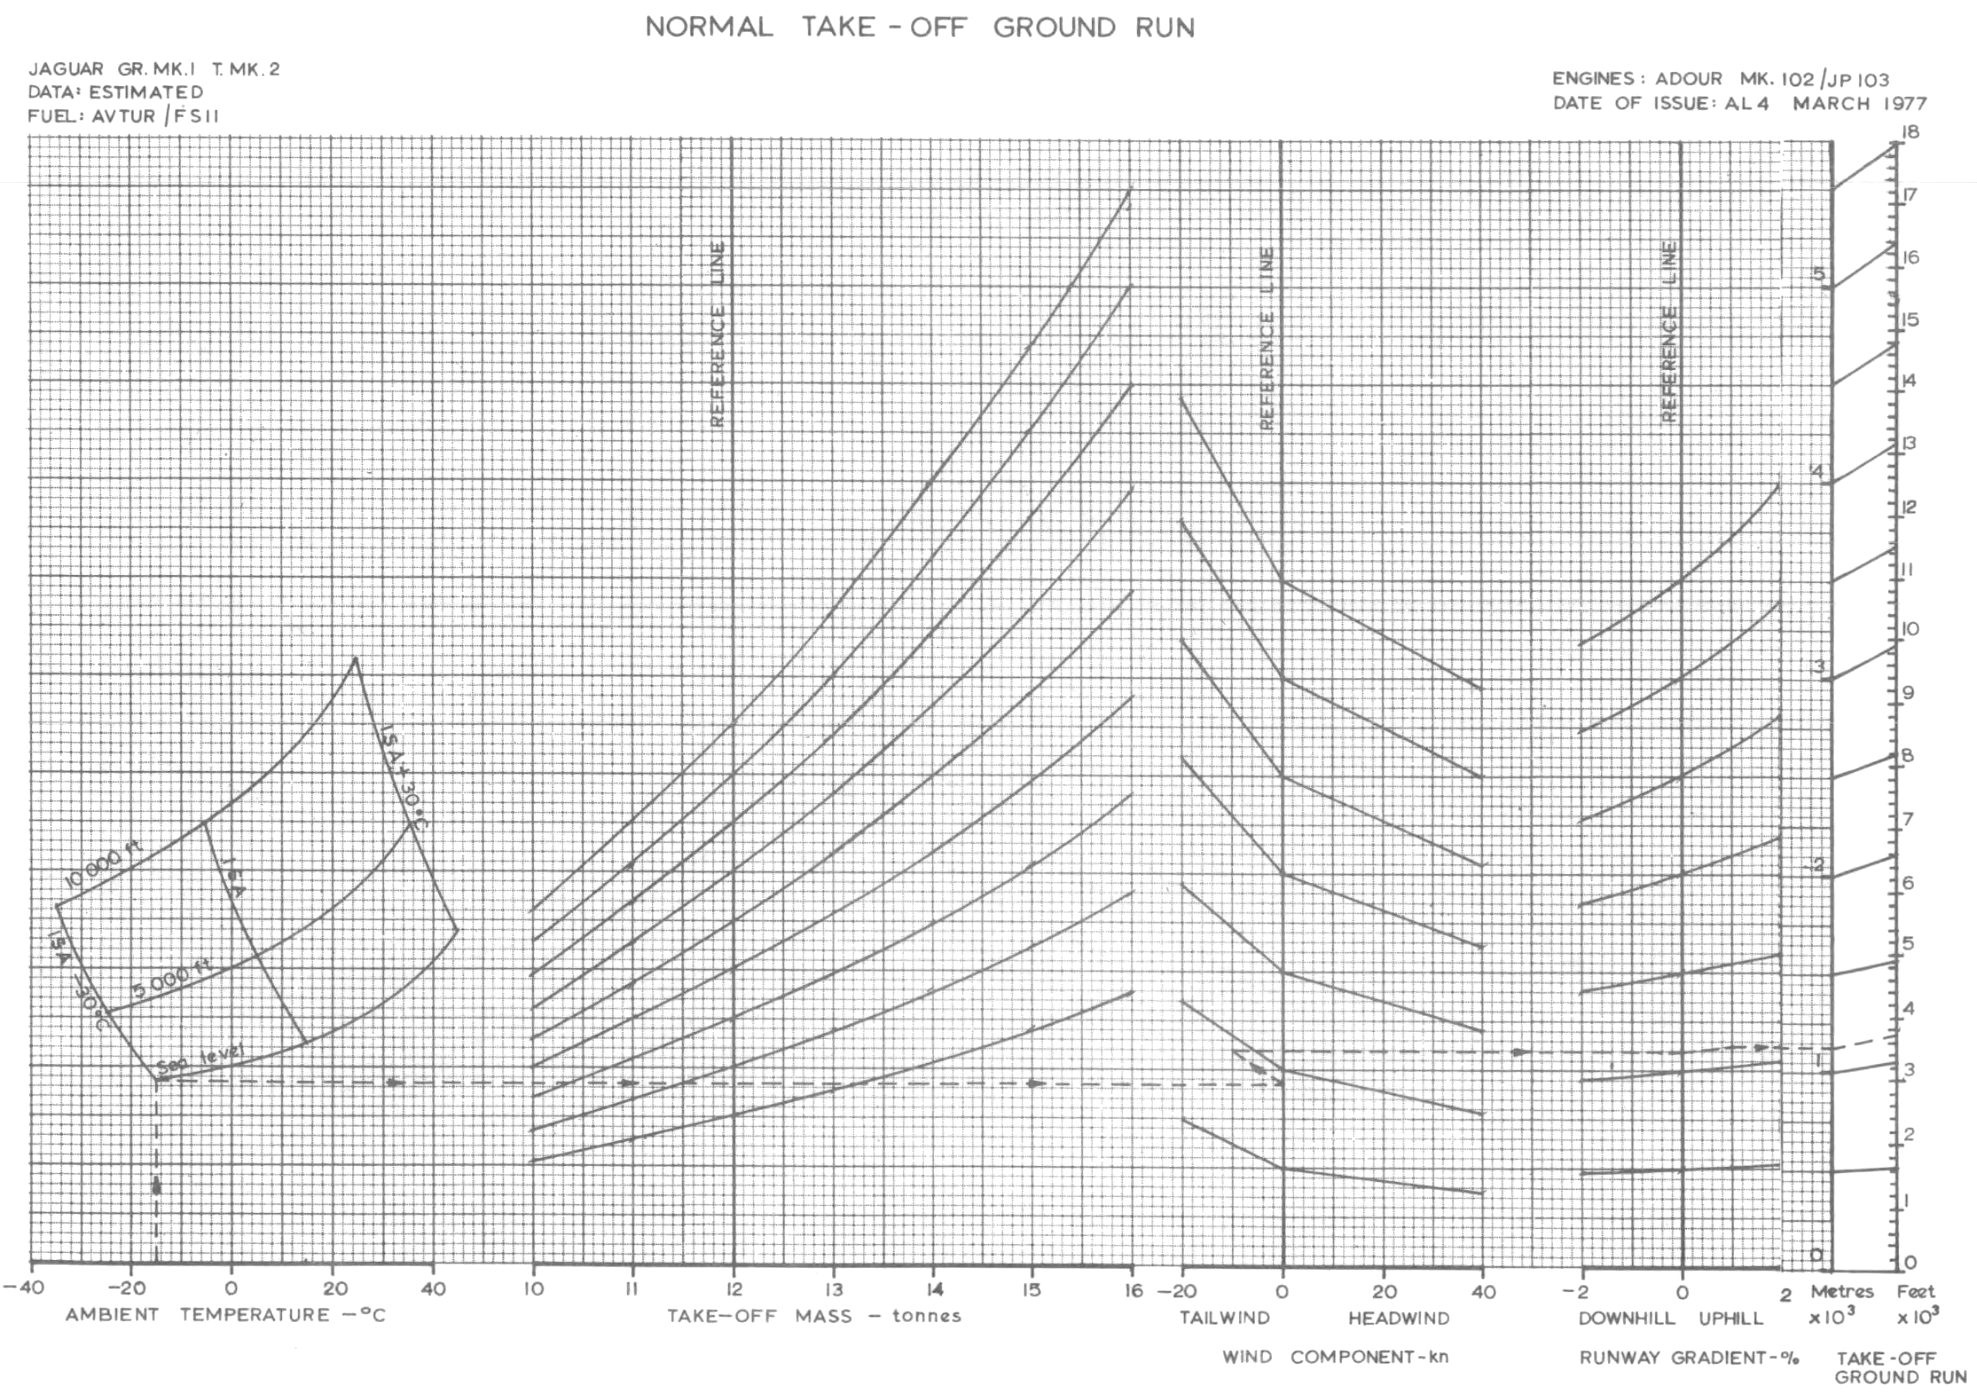
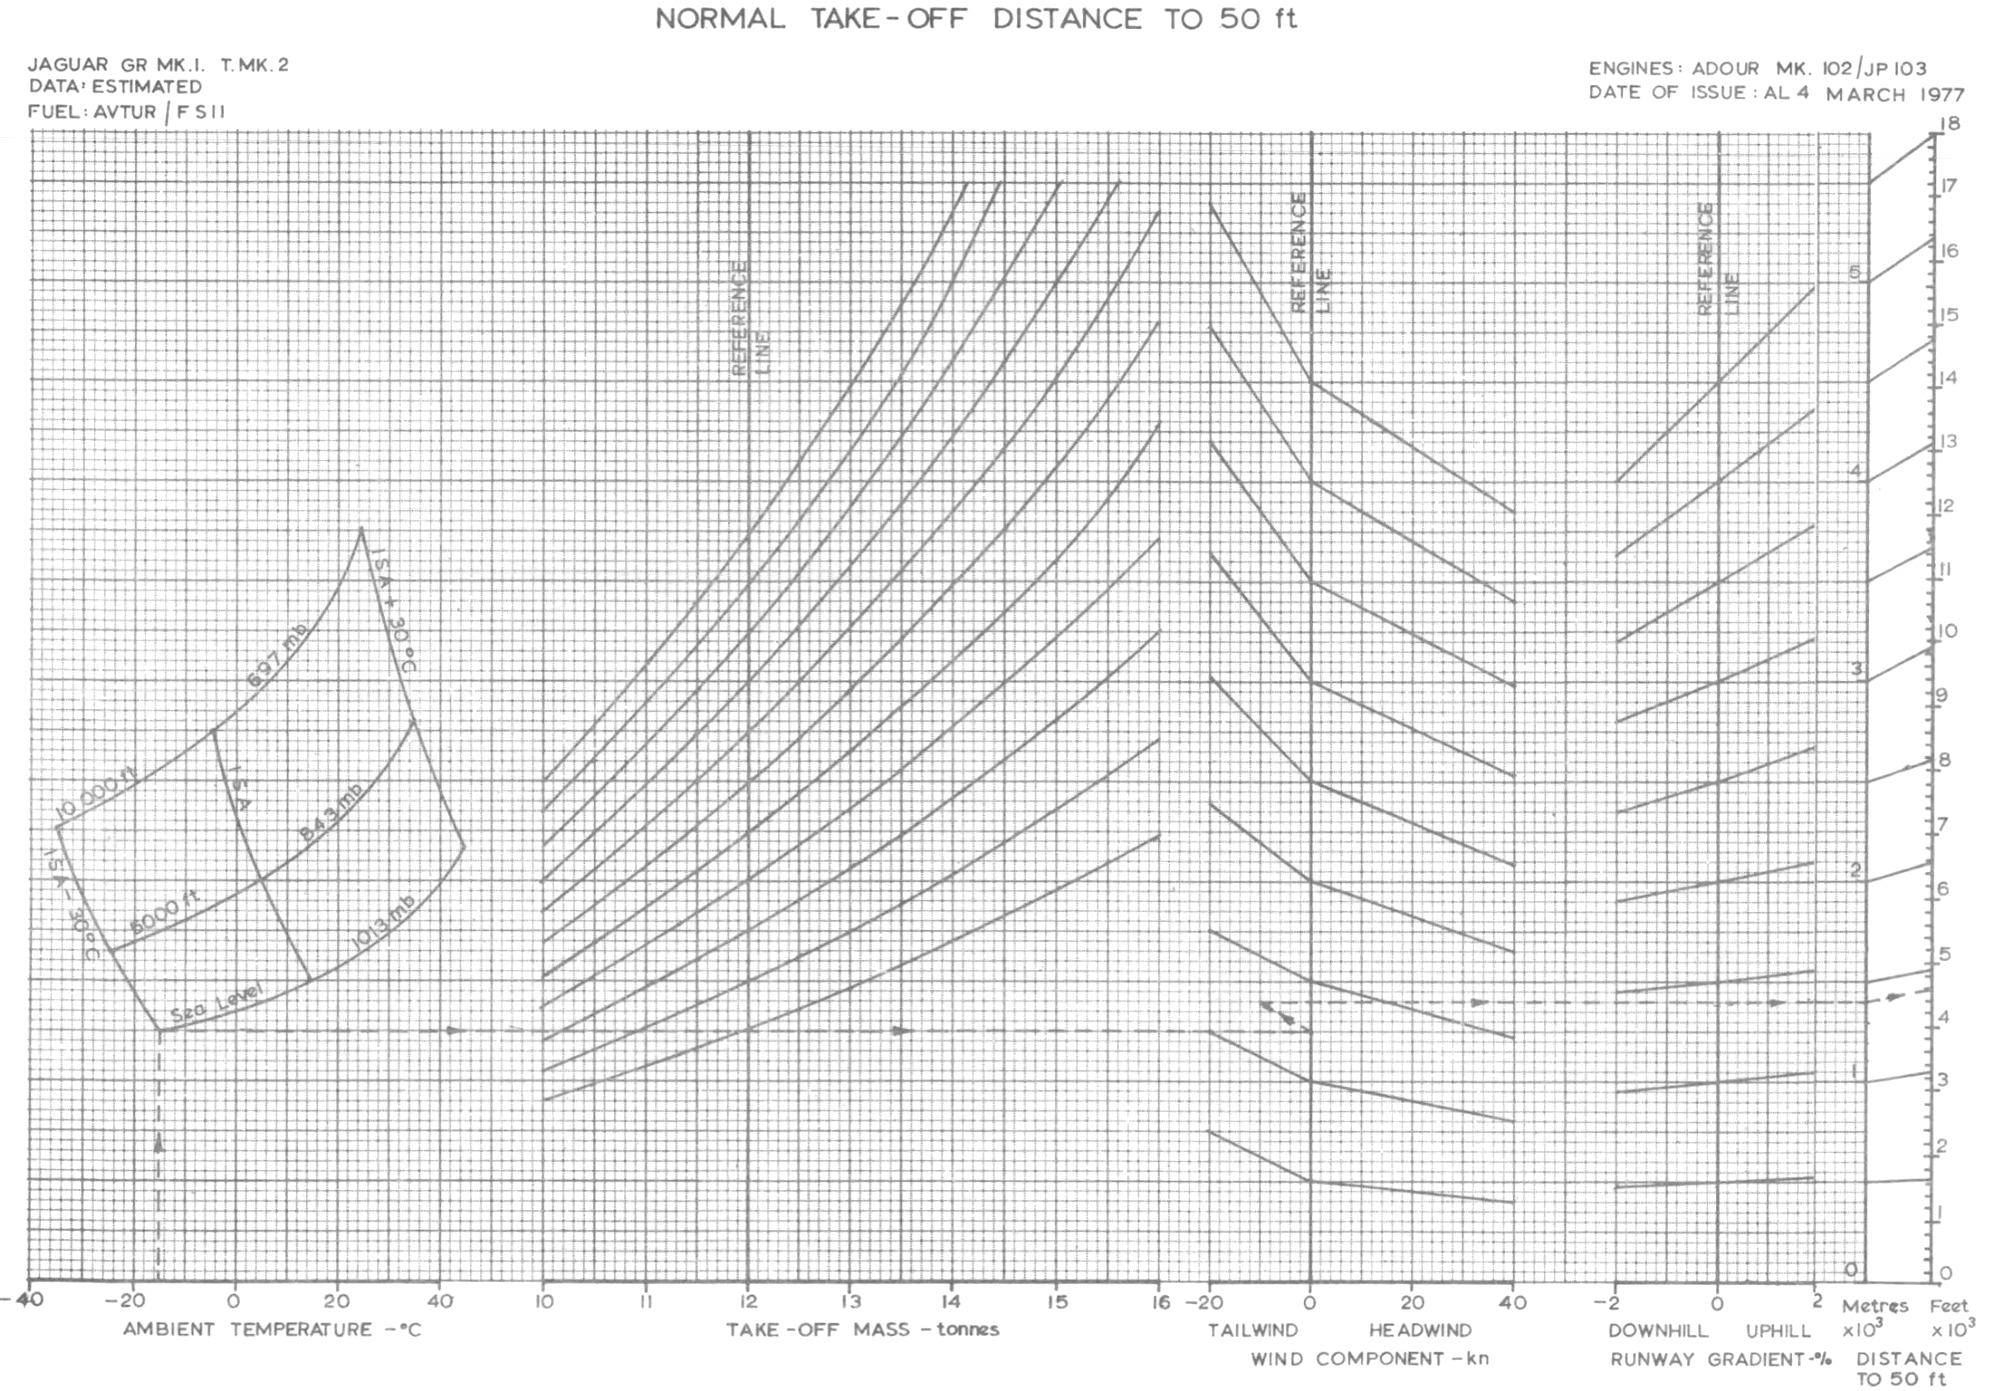
Takeoff
Takeoff is executed with 20° flaps for all configurations, and employ maximum reheat (afterburner) power.
At the defined rotation speed (VR), the stick is moved quickly and smoothly aft to rotate the aircraft to the appropriate climb-out incidence.
Once clear of the runway, the landing gear is retracted and the climb-out incidence is maintained until clear of obstacles when the incidence may be reduced to permit the aircraft to accelerate more rapidly.
Flap is selected up at a safe speed depending on aircraft mass.
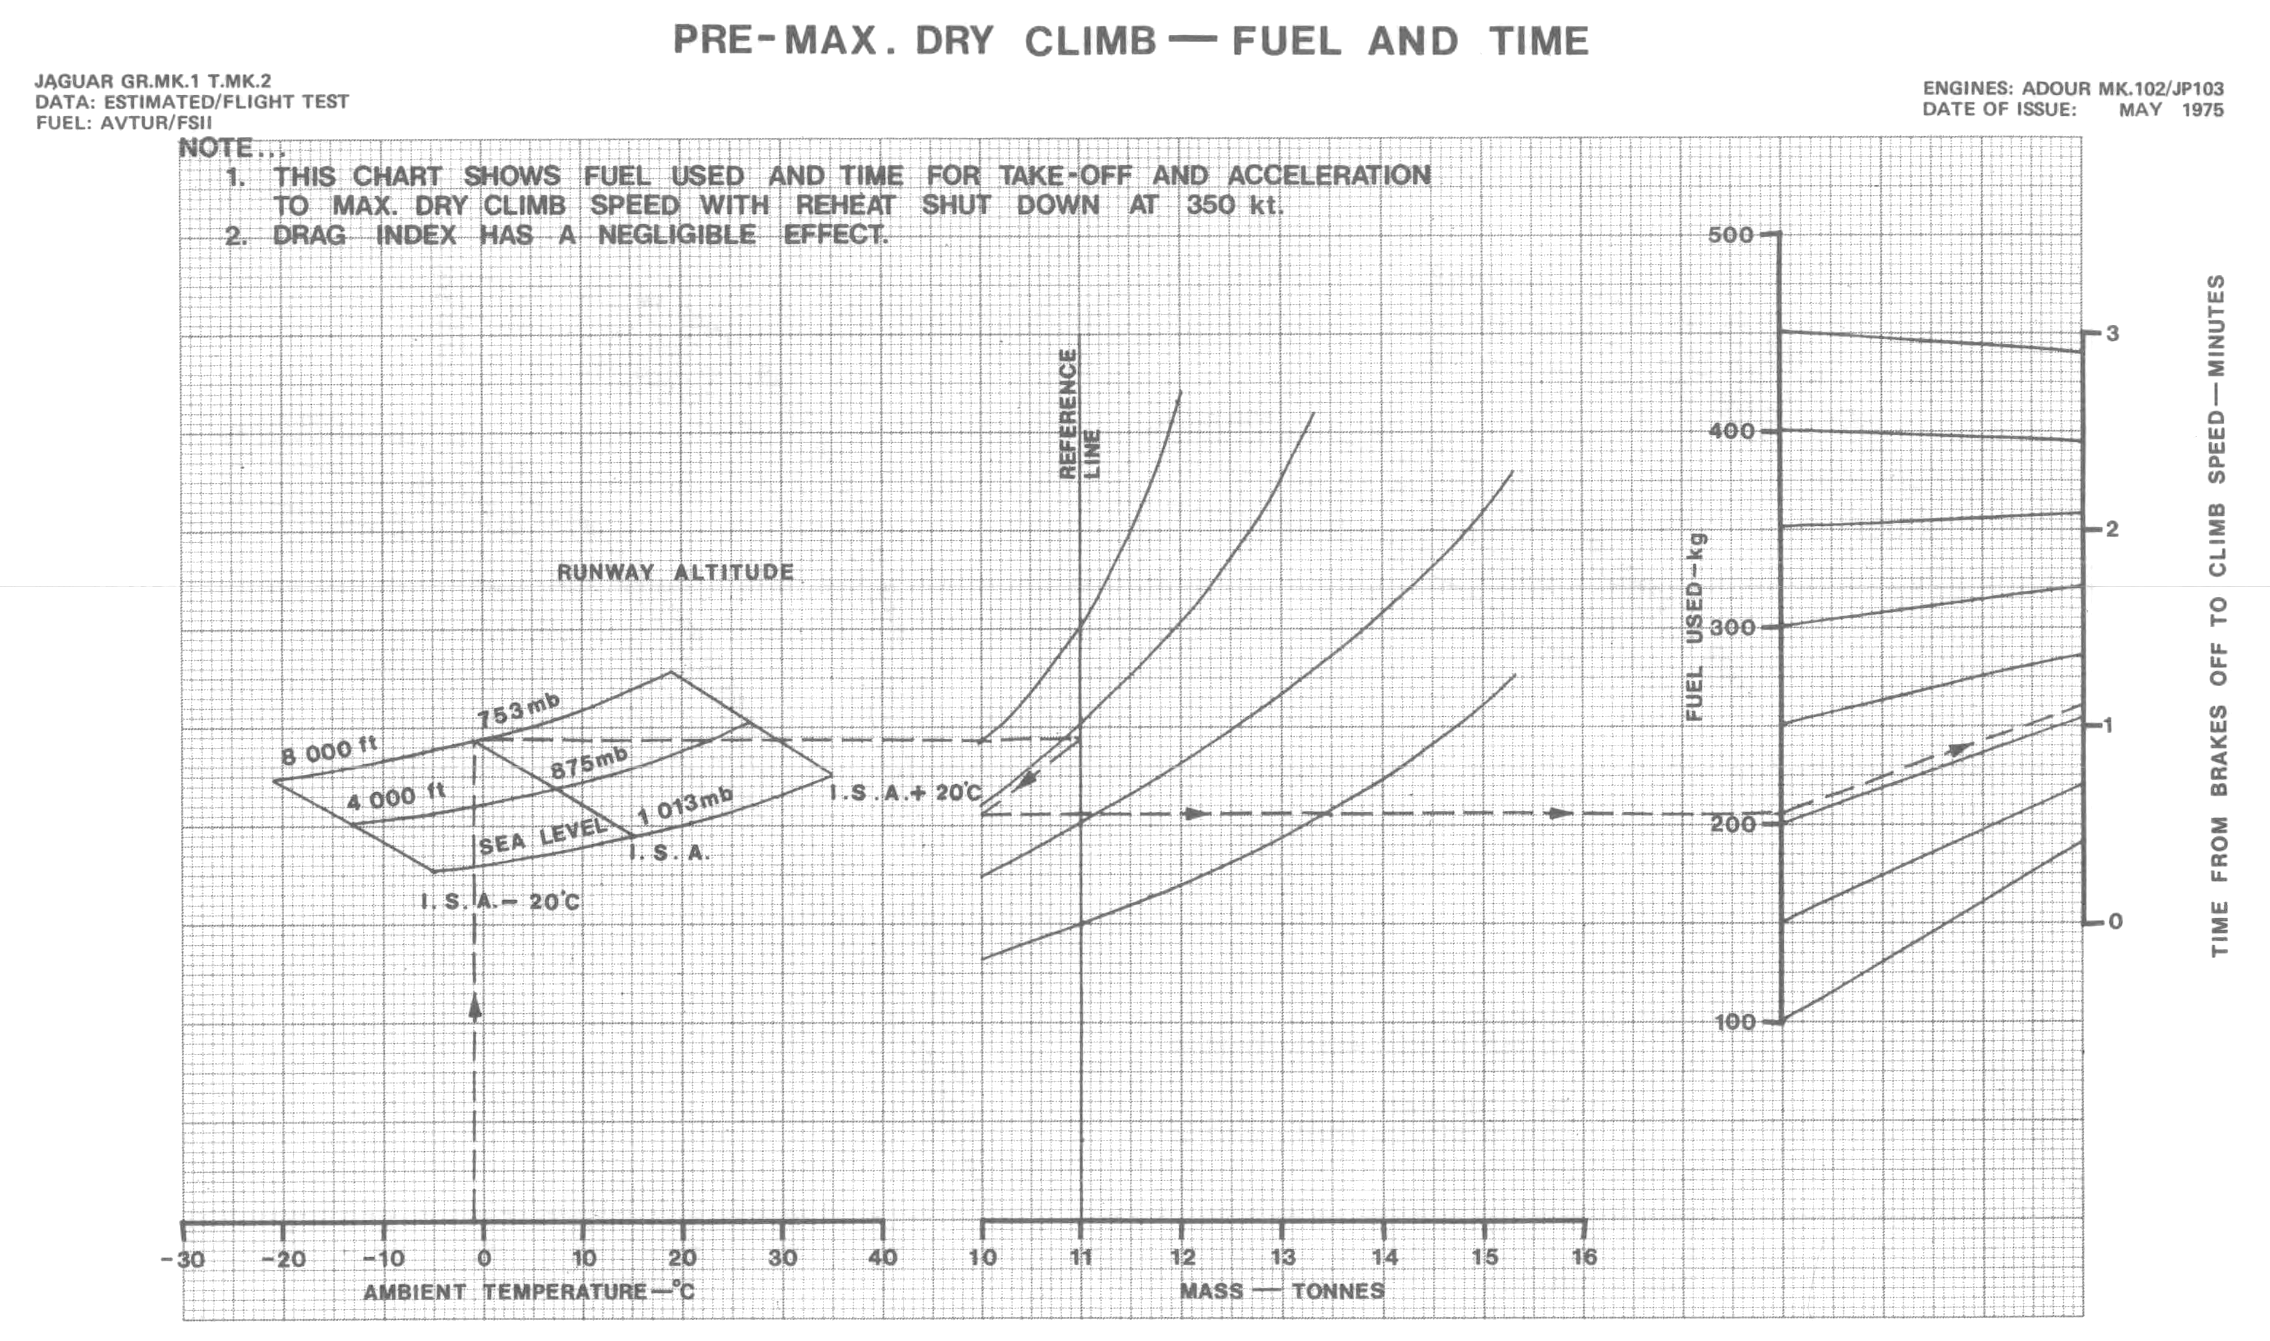
Climb
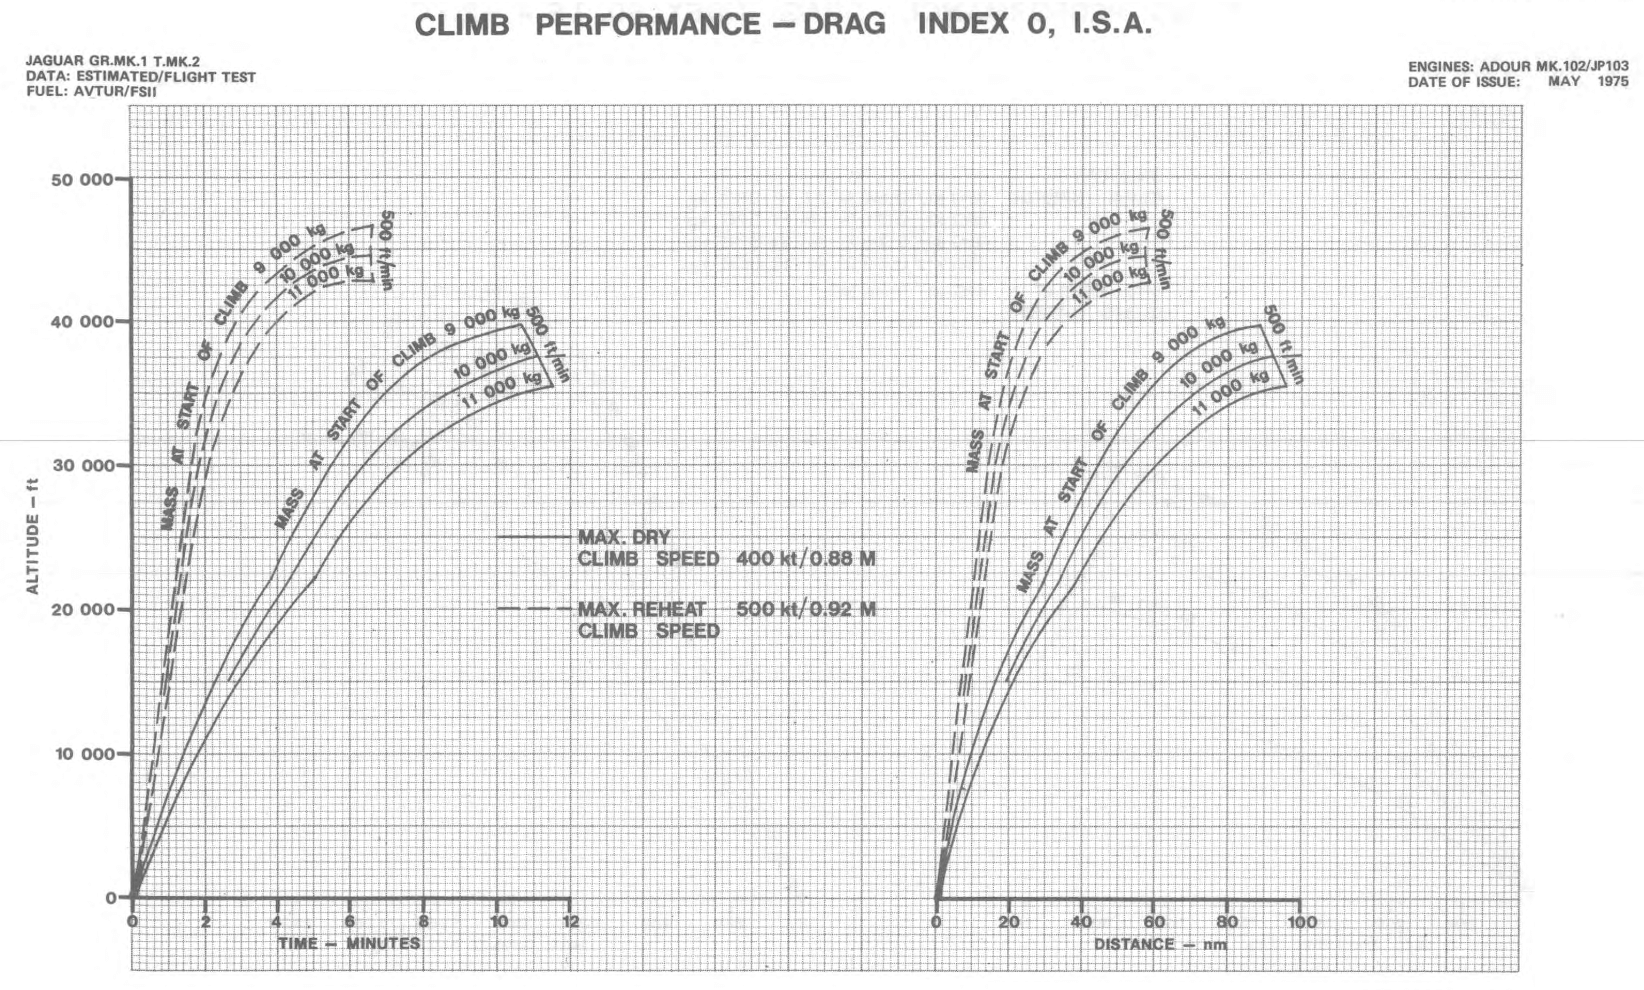
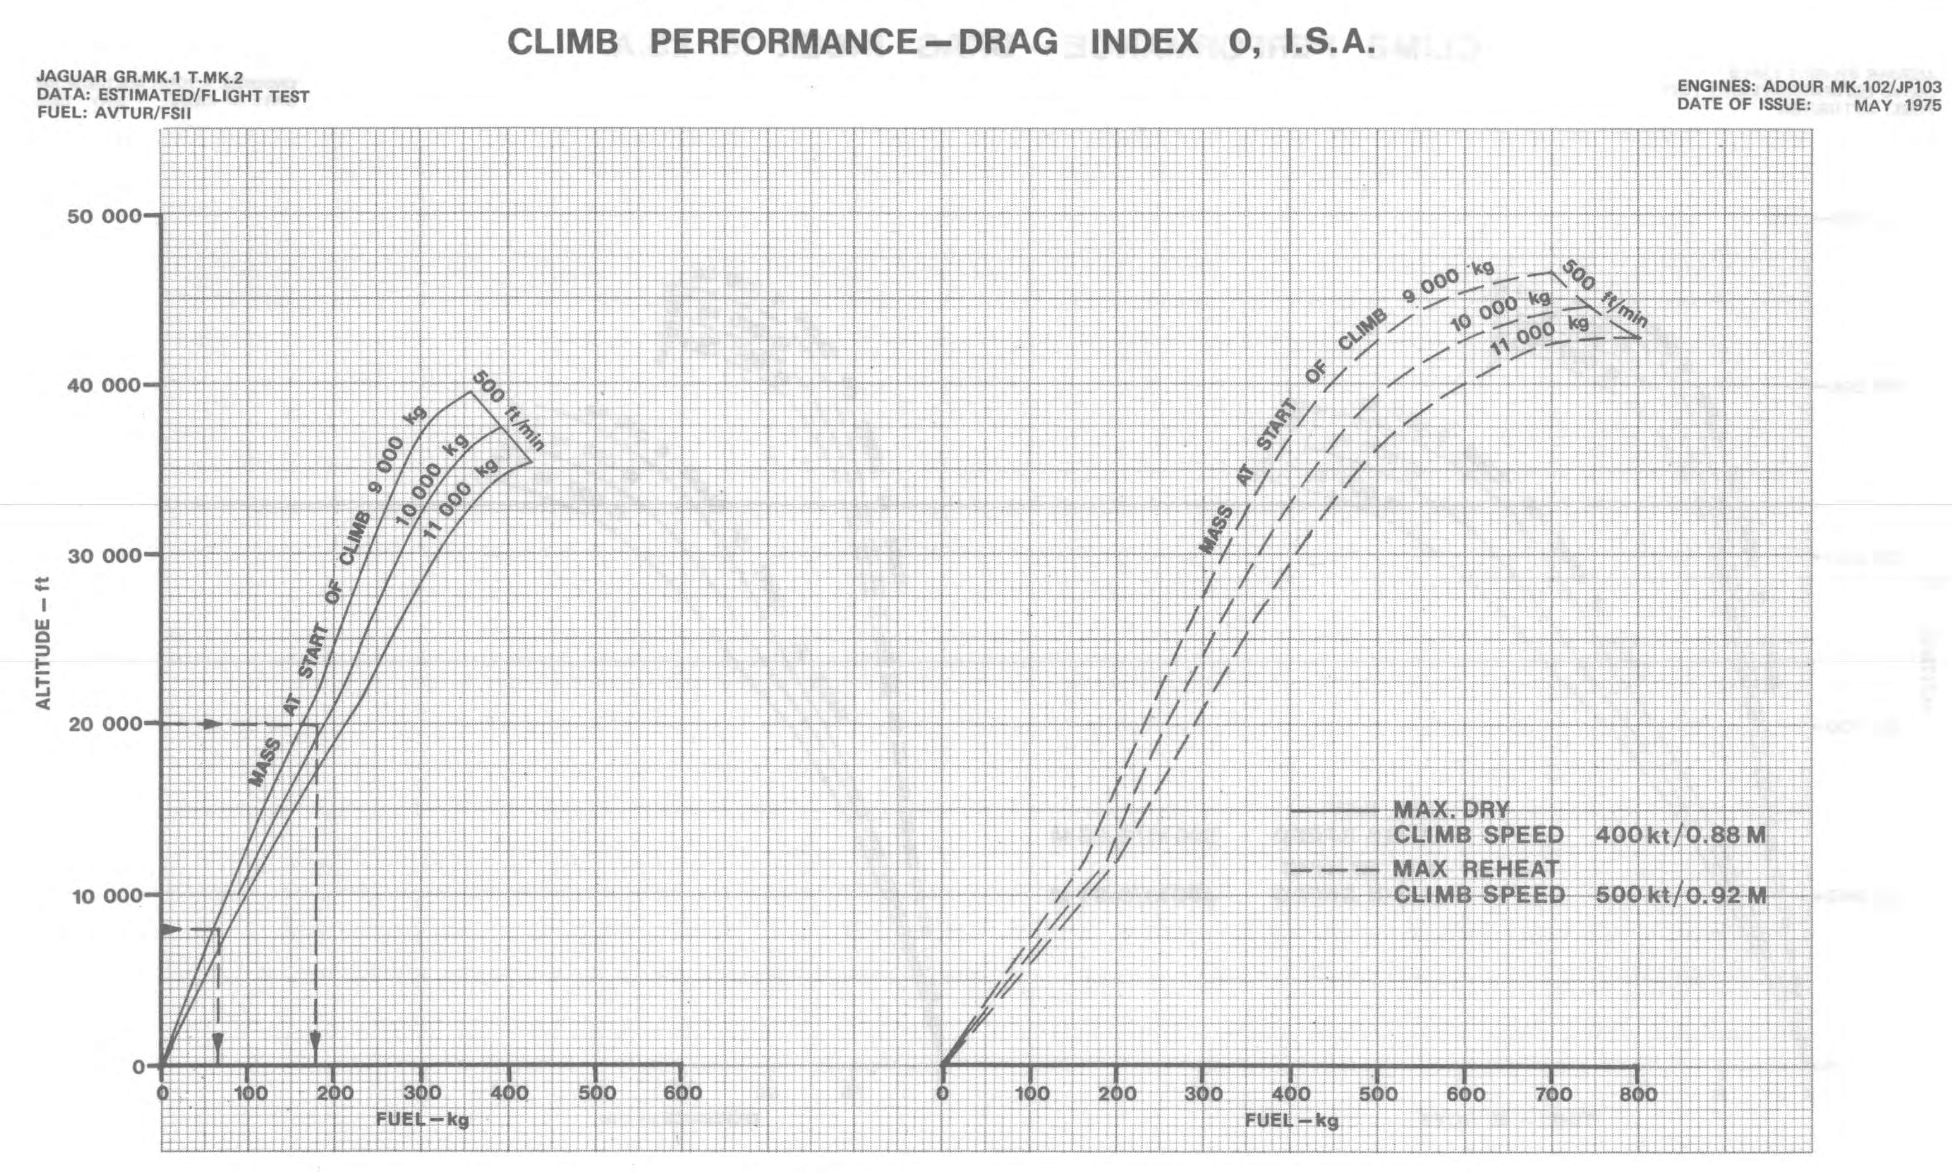
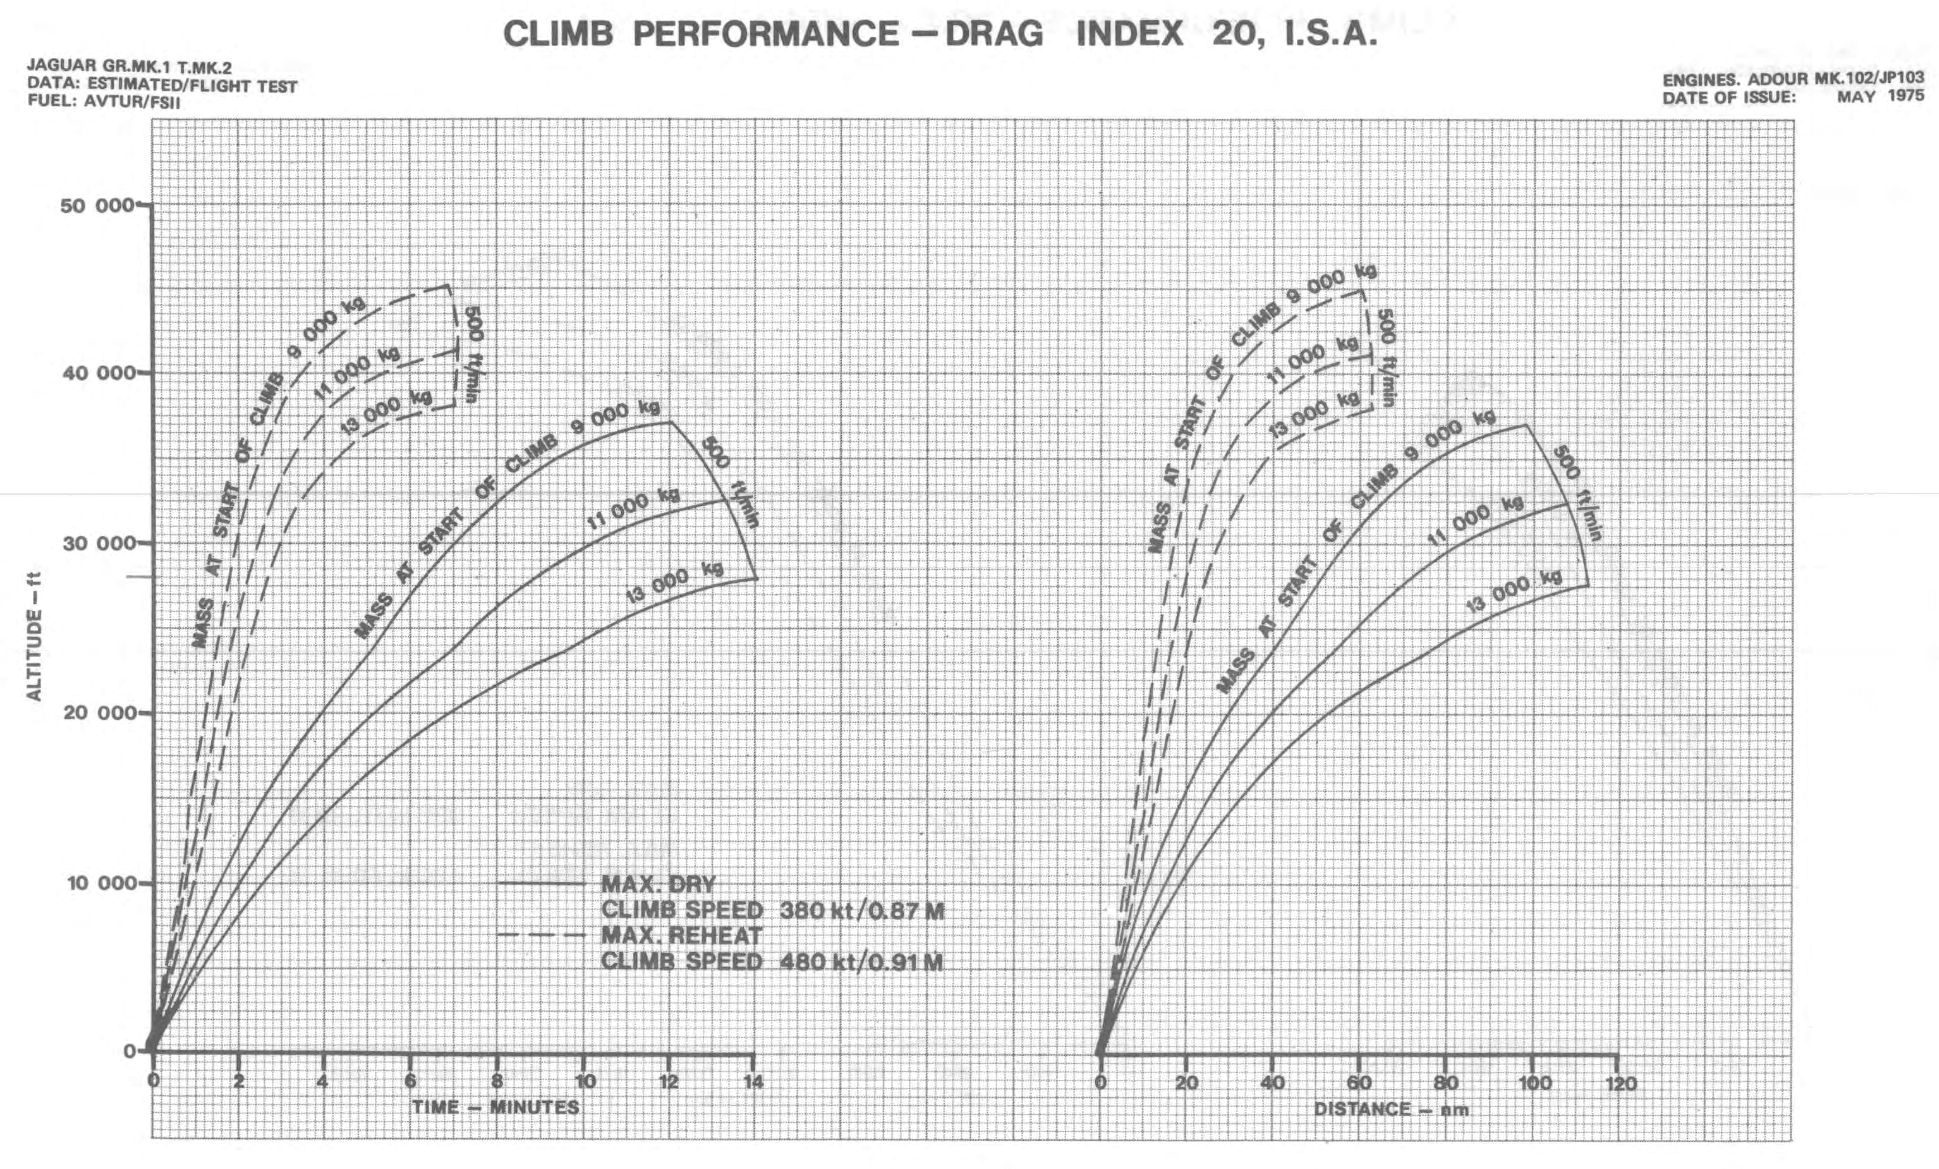
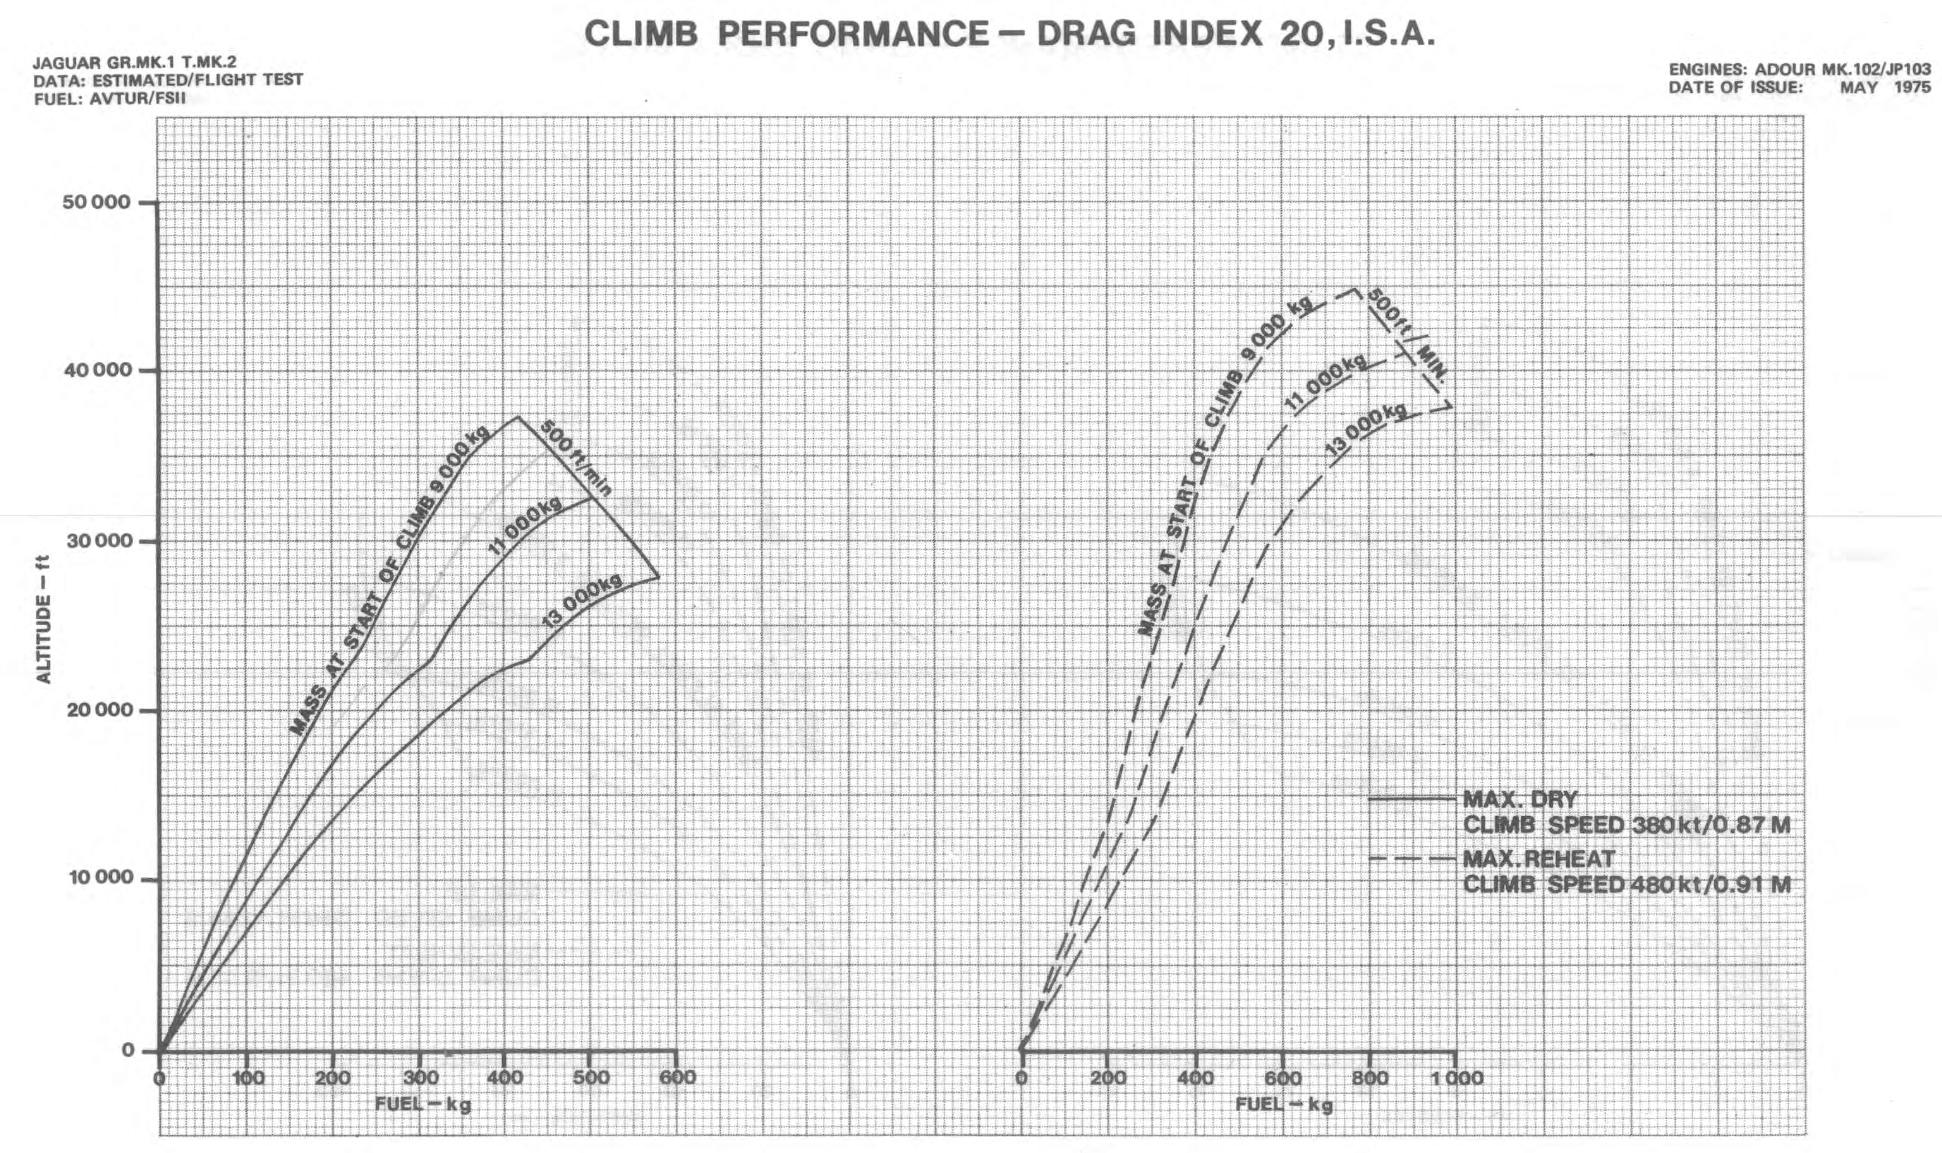
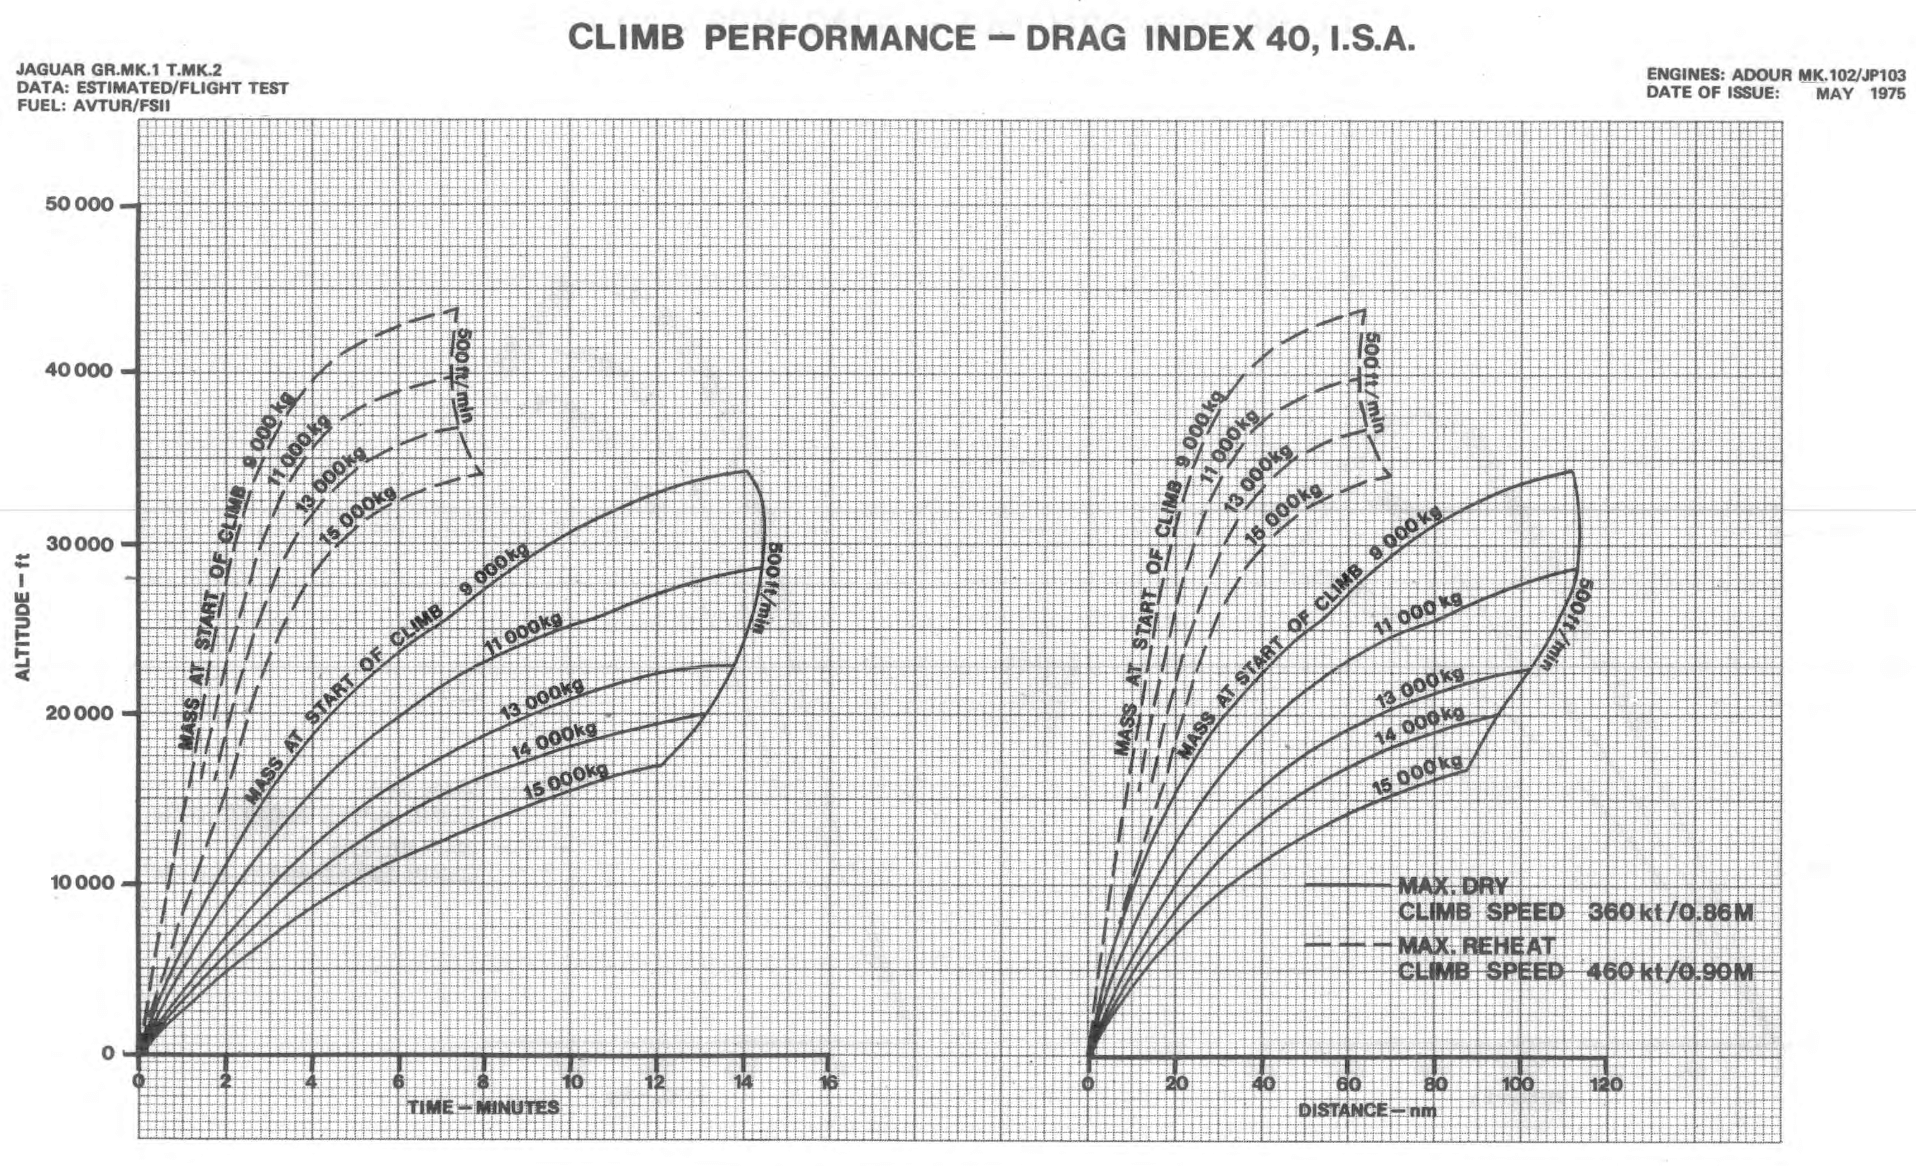
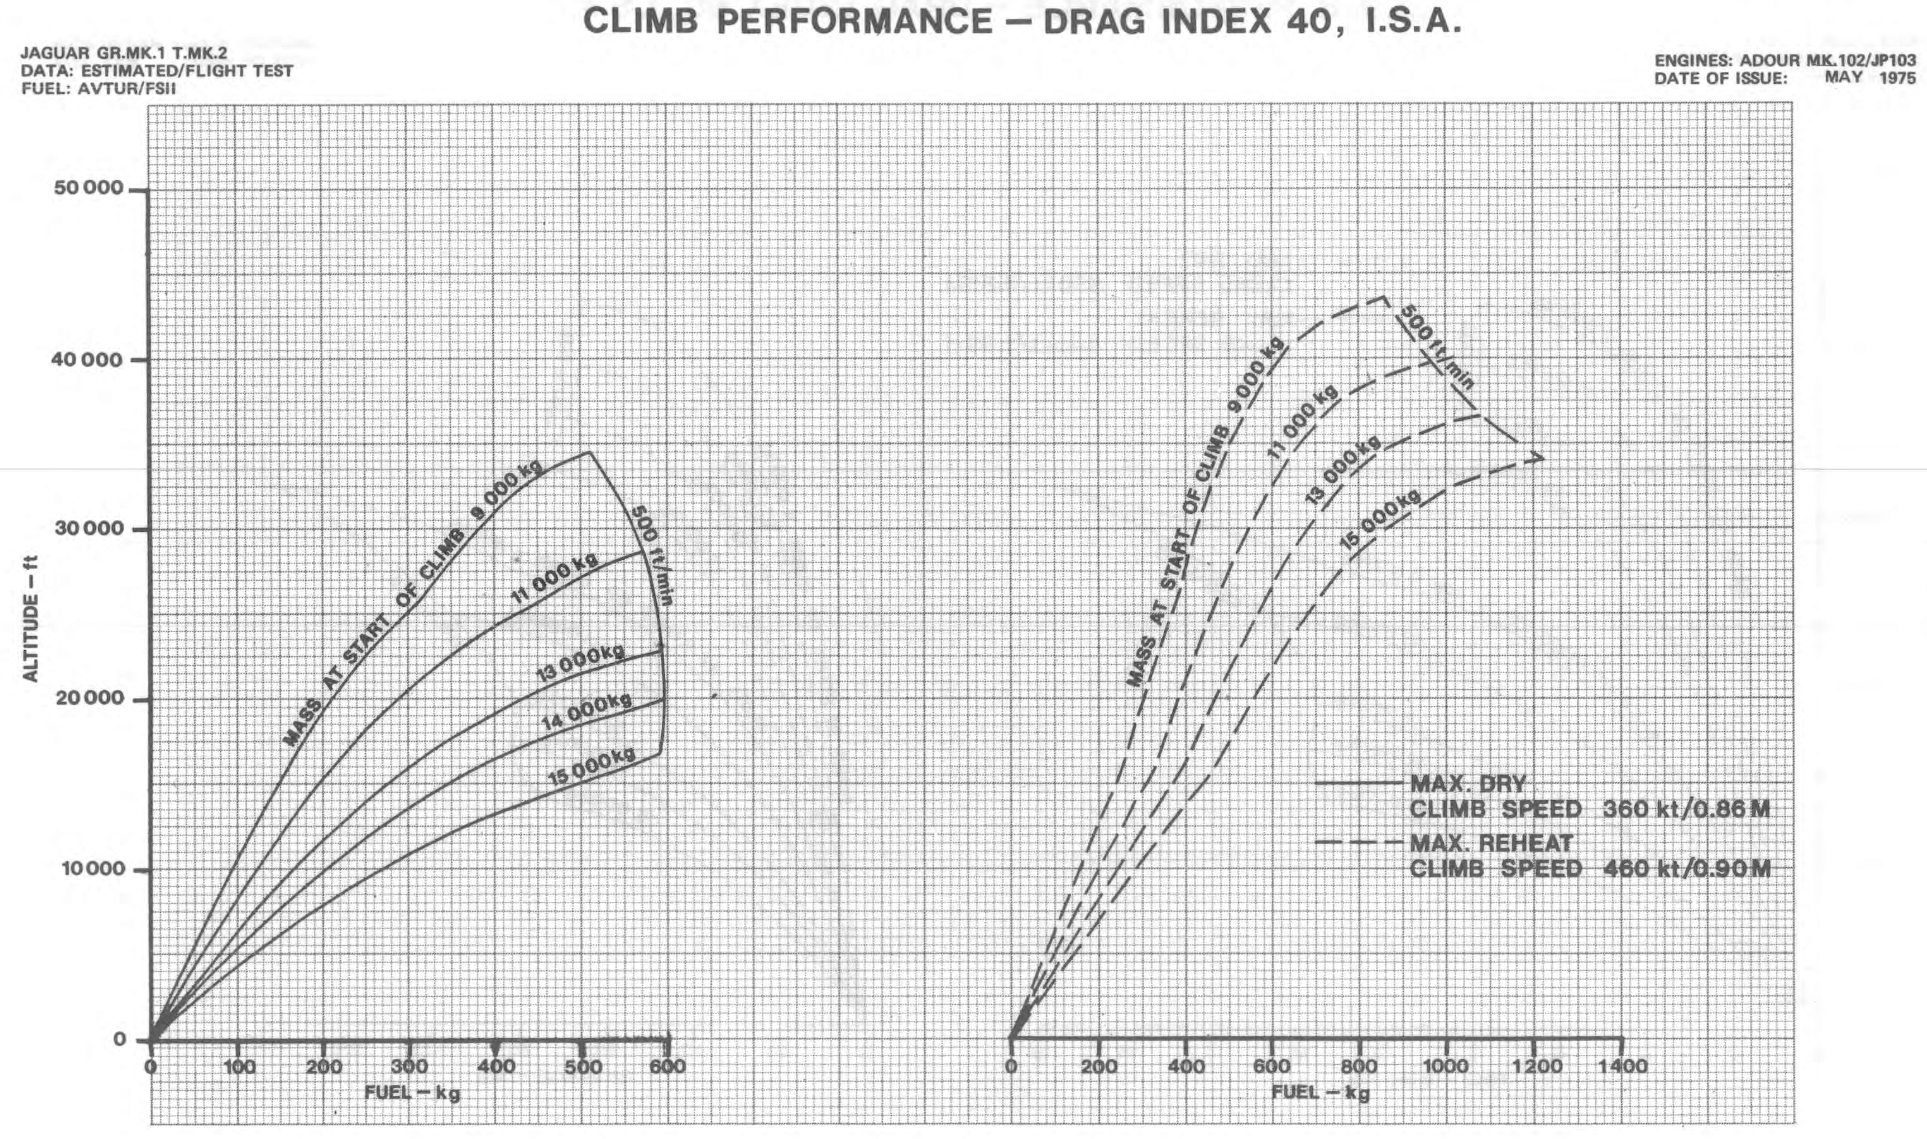
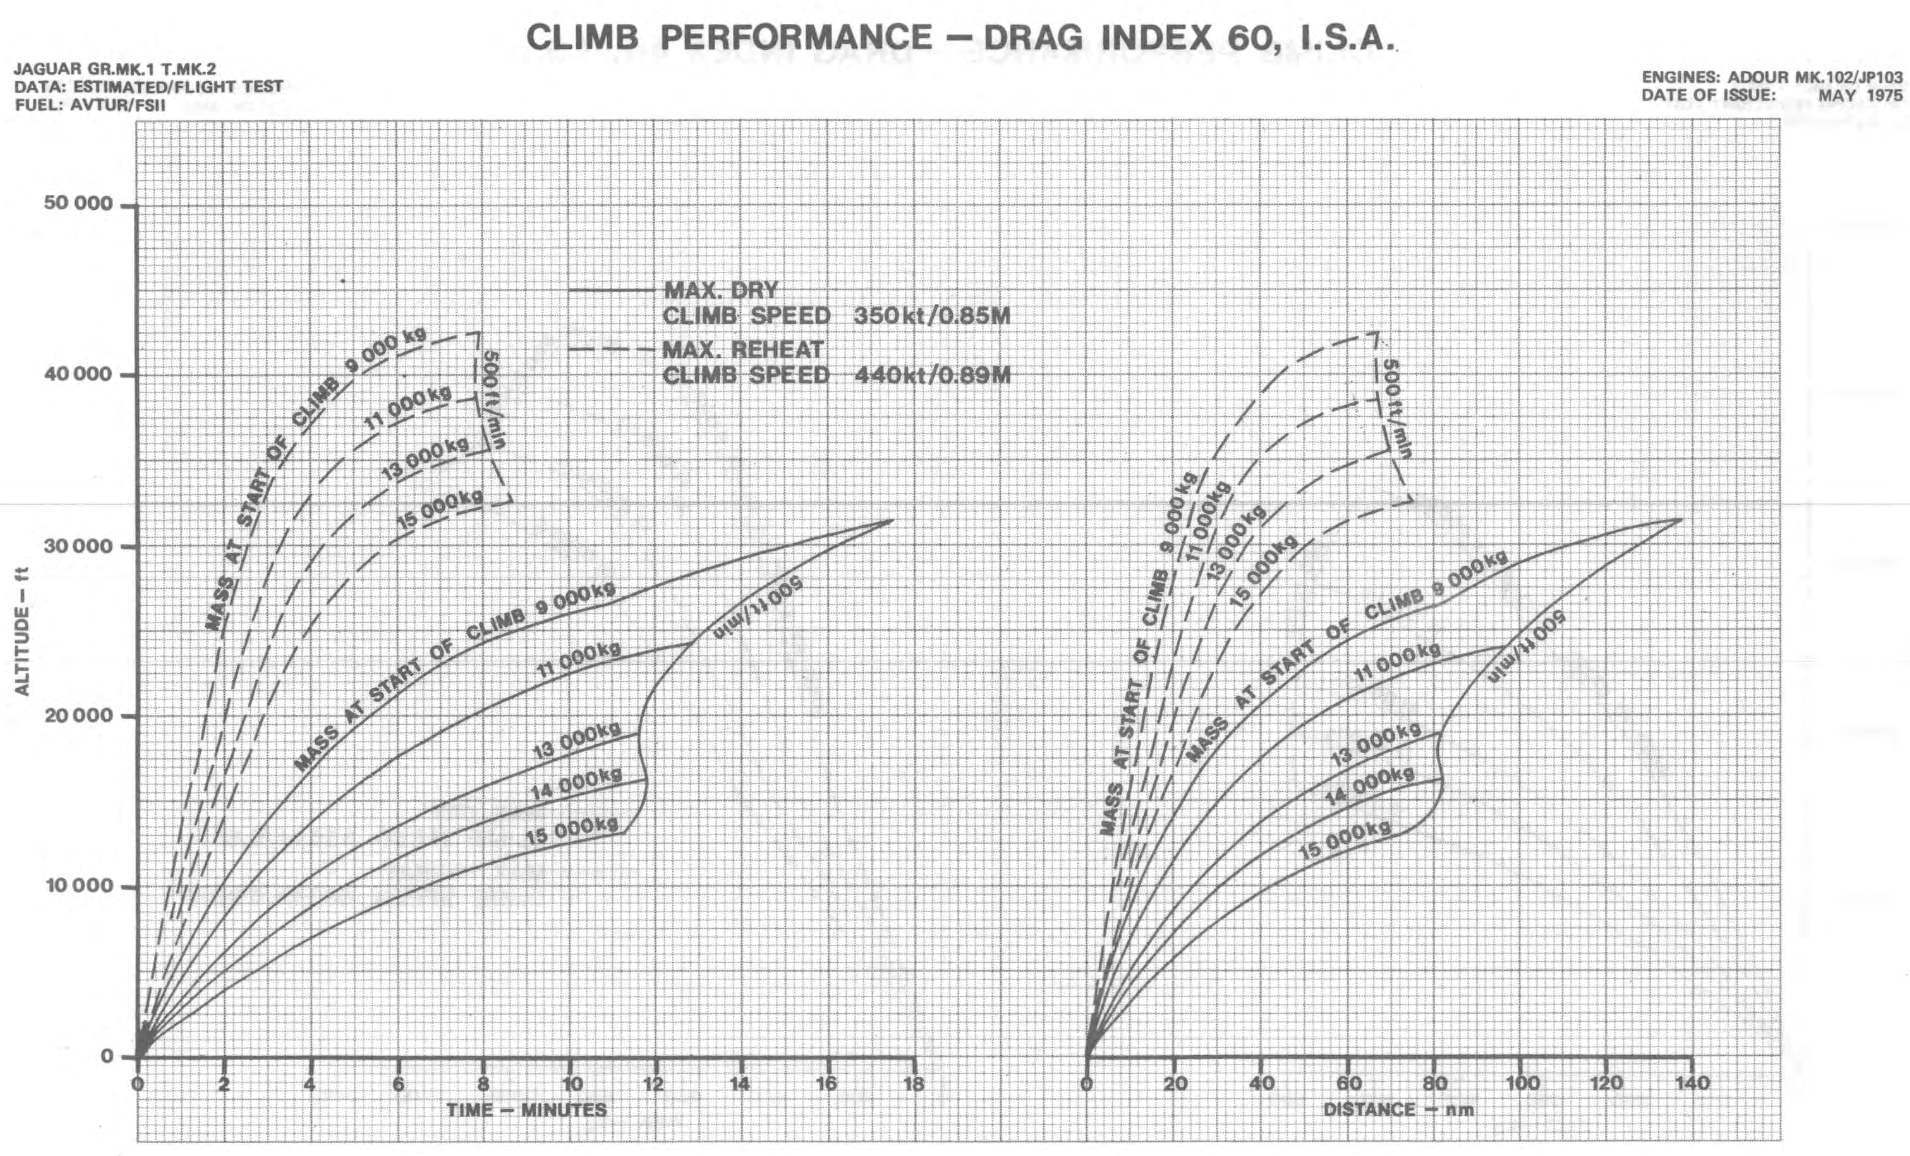
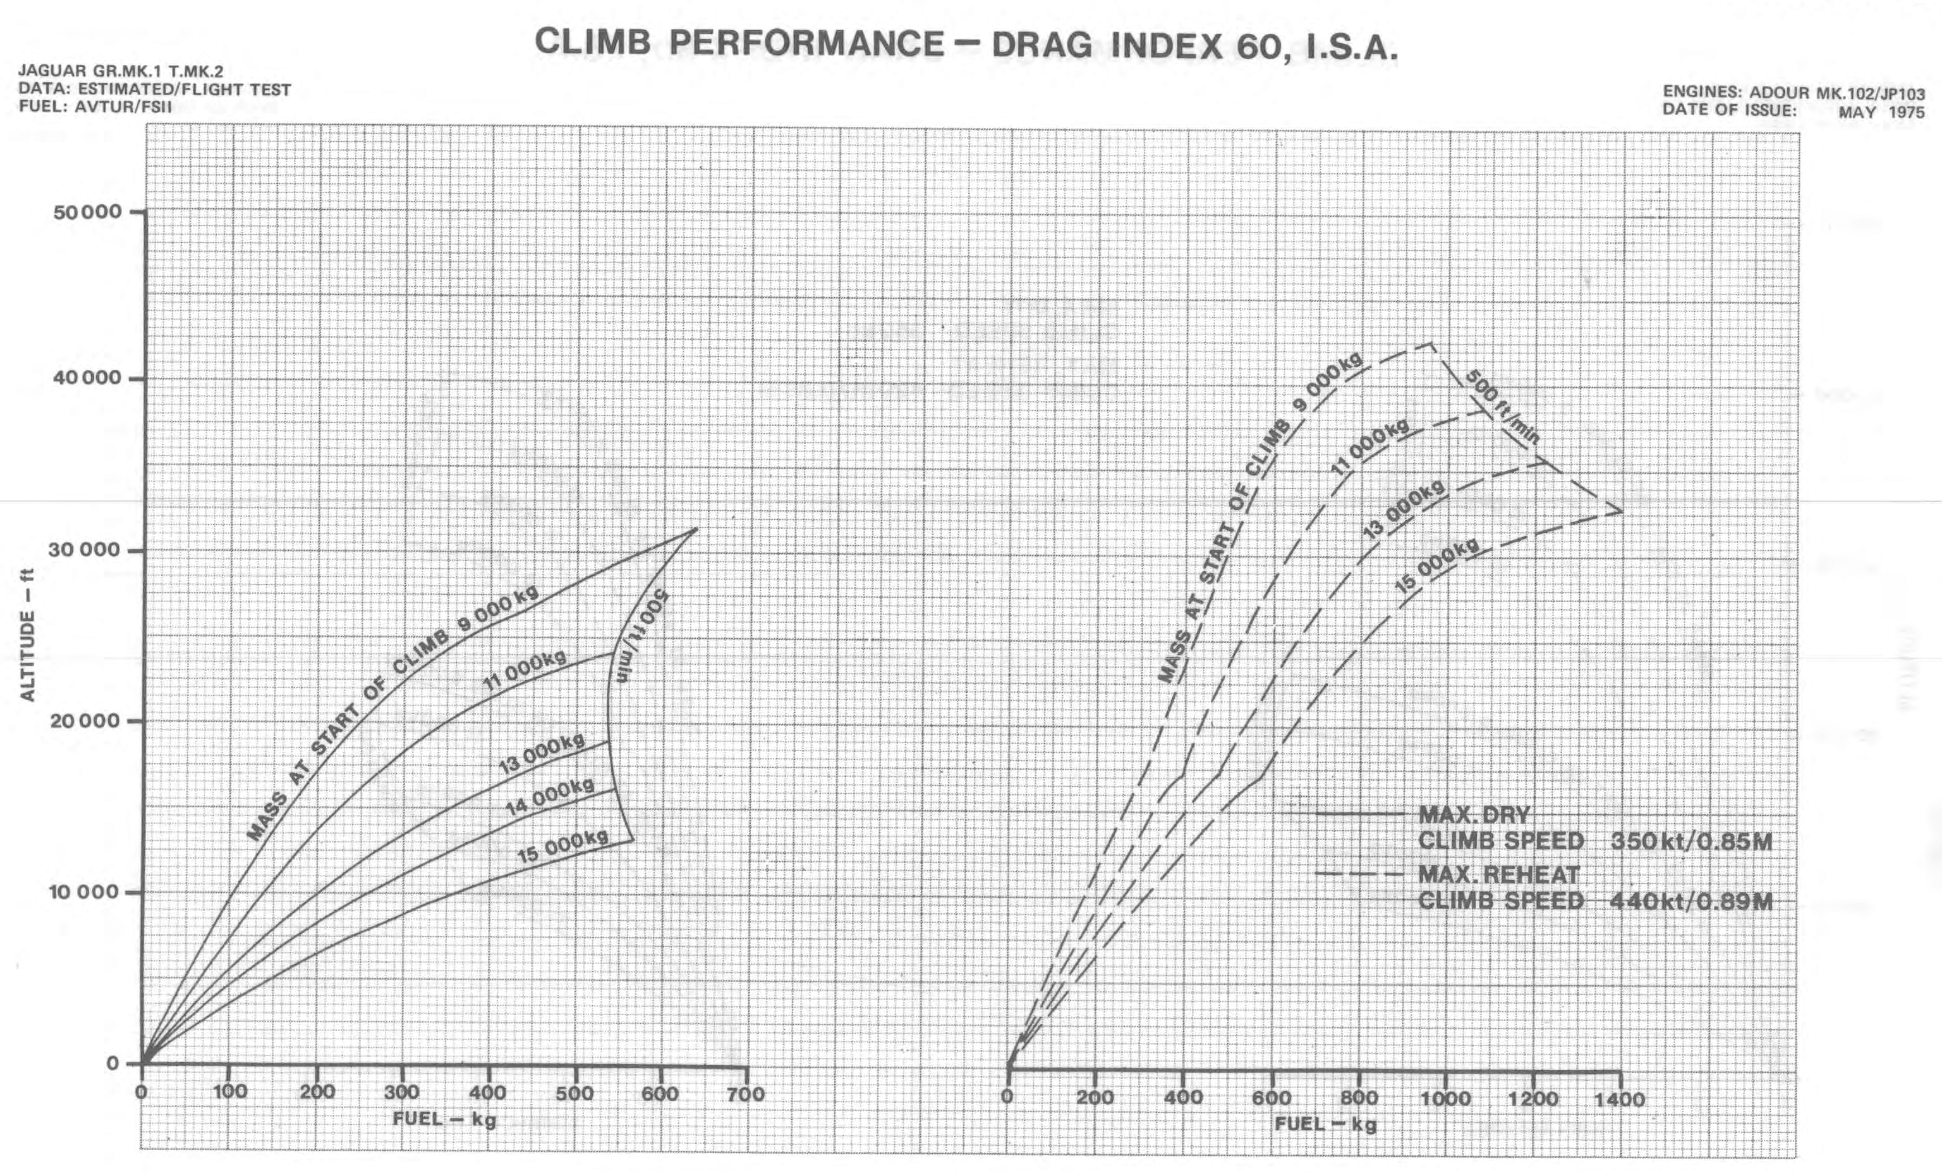
Climb performance charts are presented for various drag indexes, in I.S.A. conditions (+15°C at sea level, pressure 1013.2 millibars).
First chart shows fuel used and time for takeoff and acceleration to max dry climb (where drag index has a negligible effect).
Other charts show, for each drag index, a first chart to calculate time and distance to reach a desired altitude, and a second chart to calculate the fuel needed.
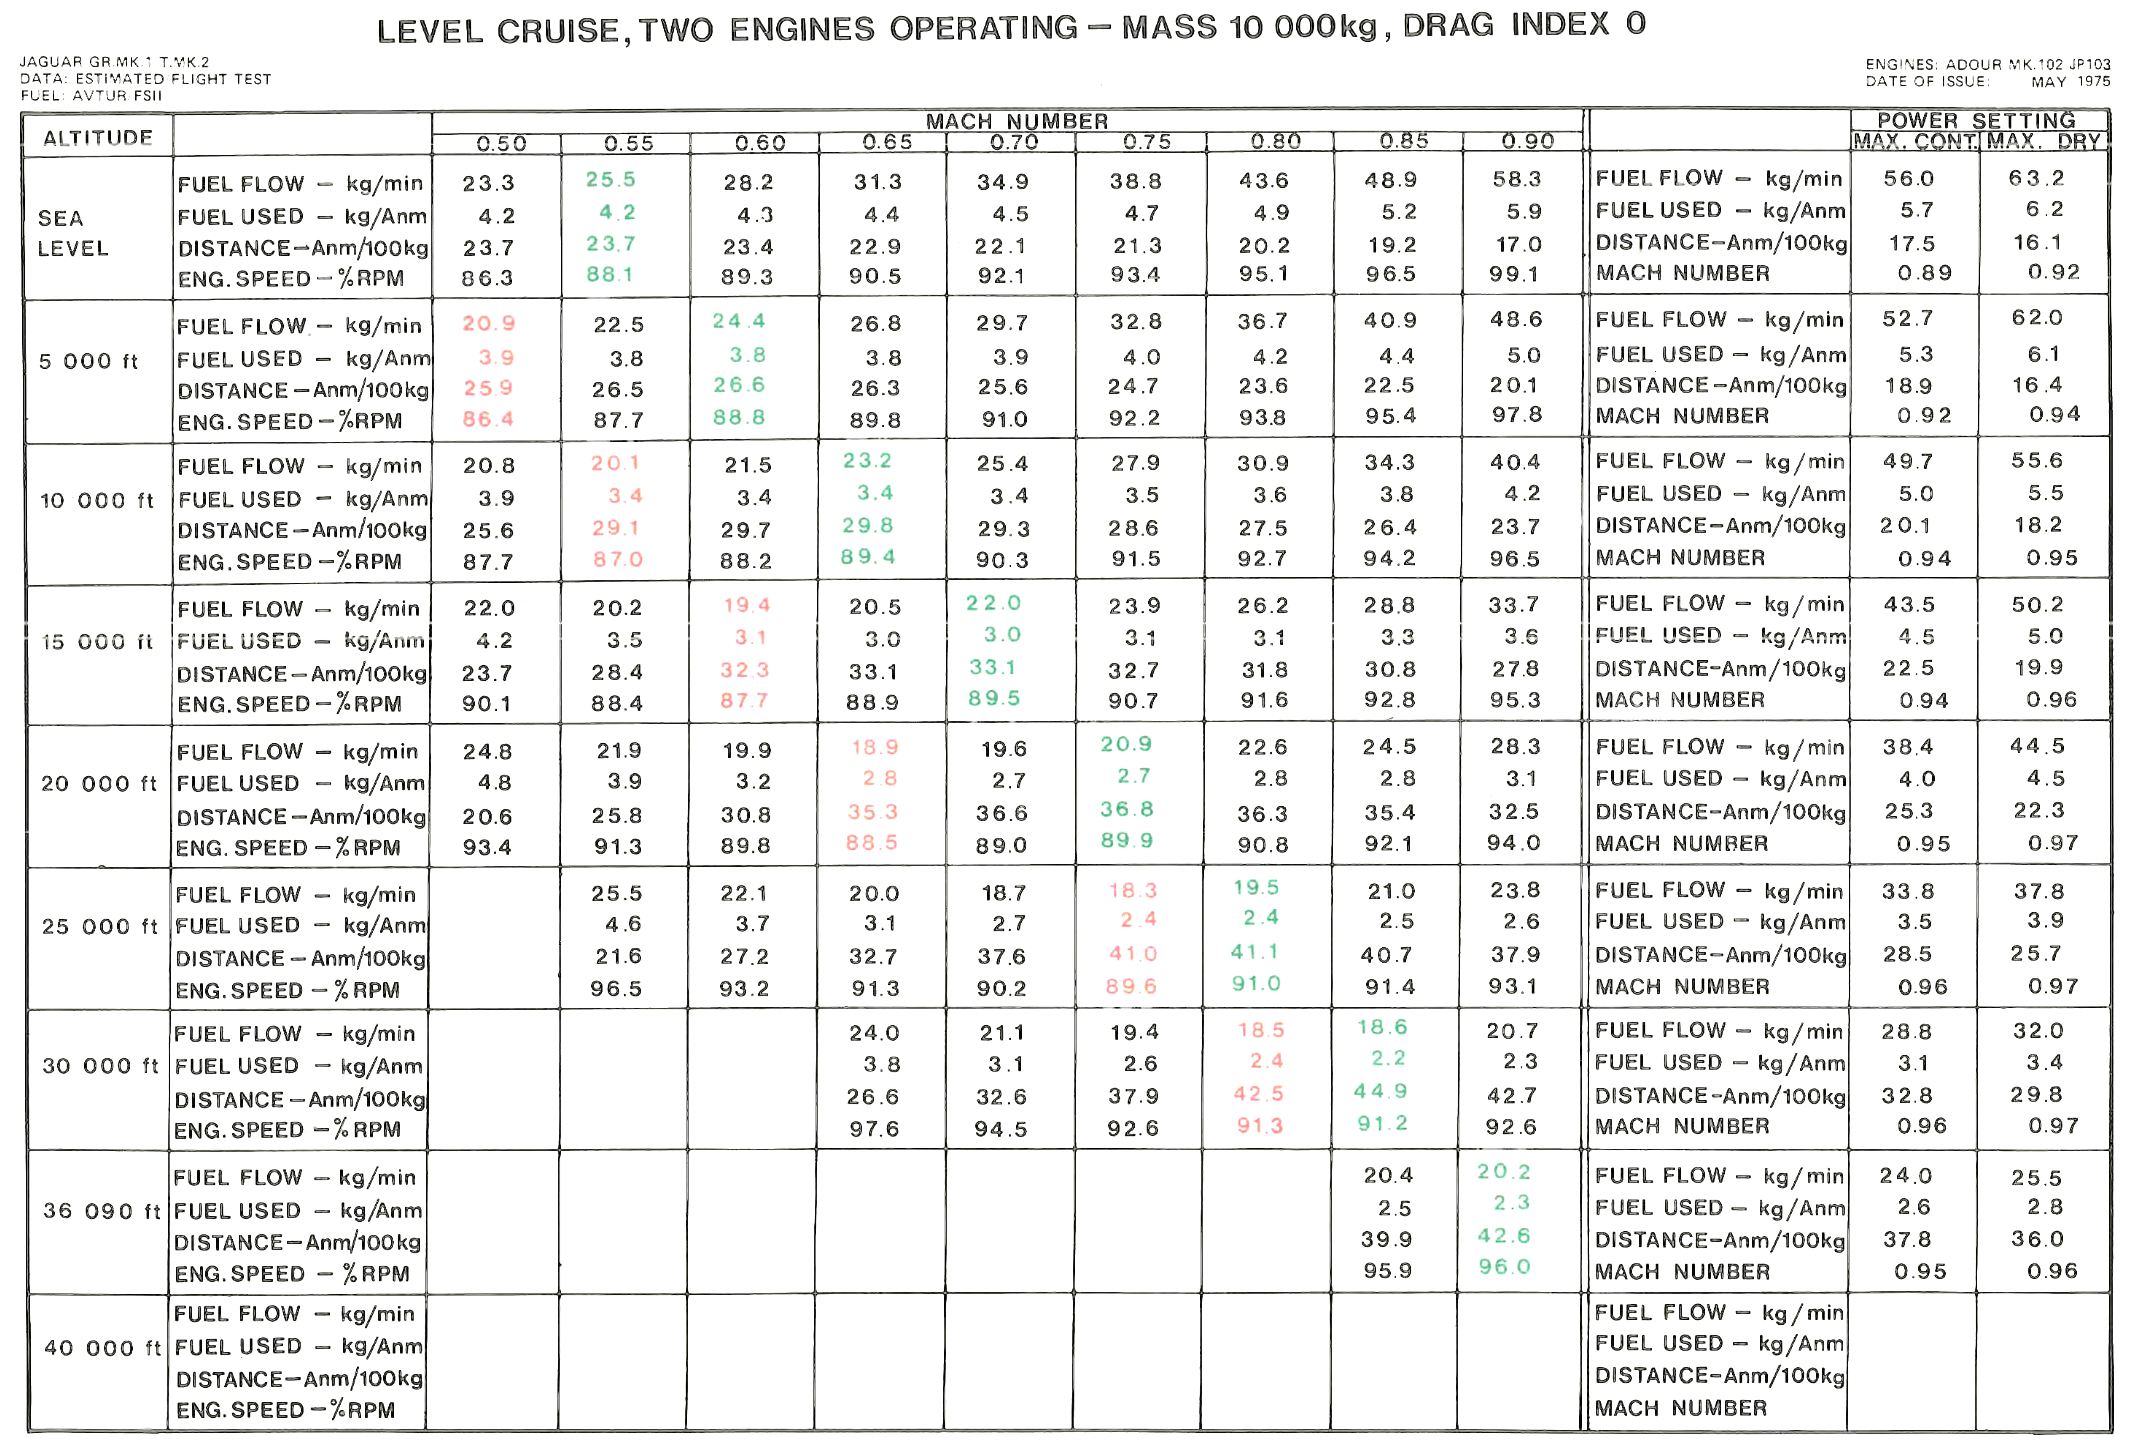
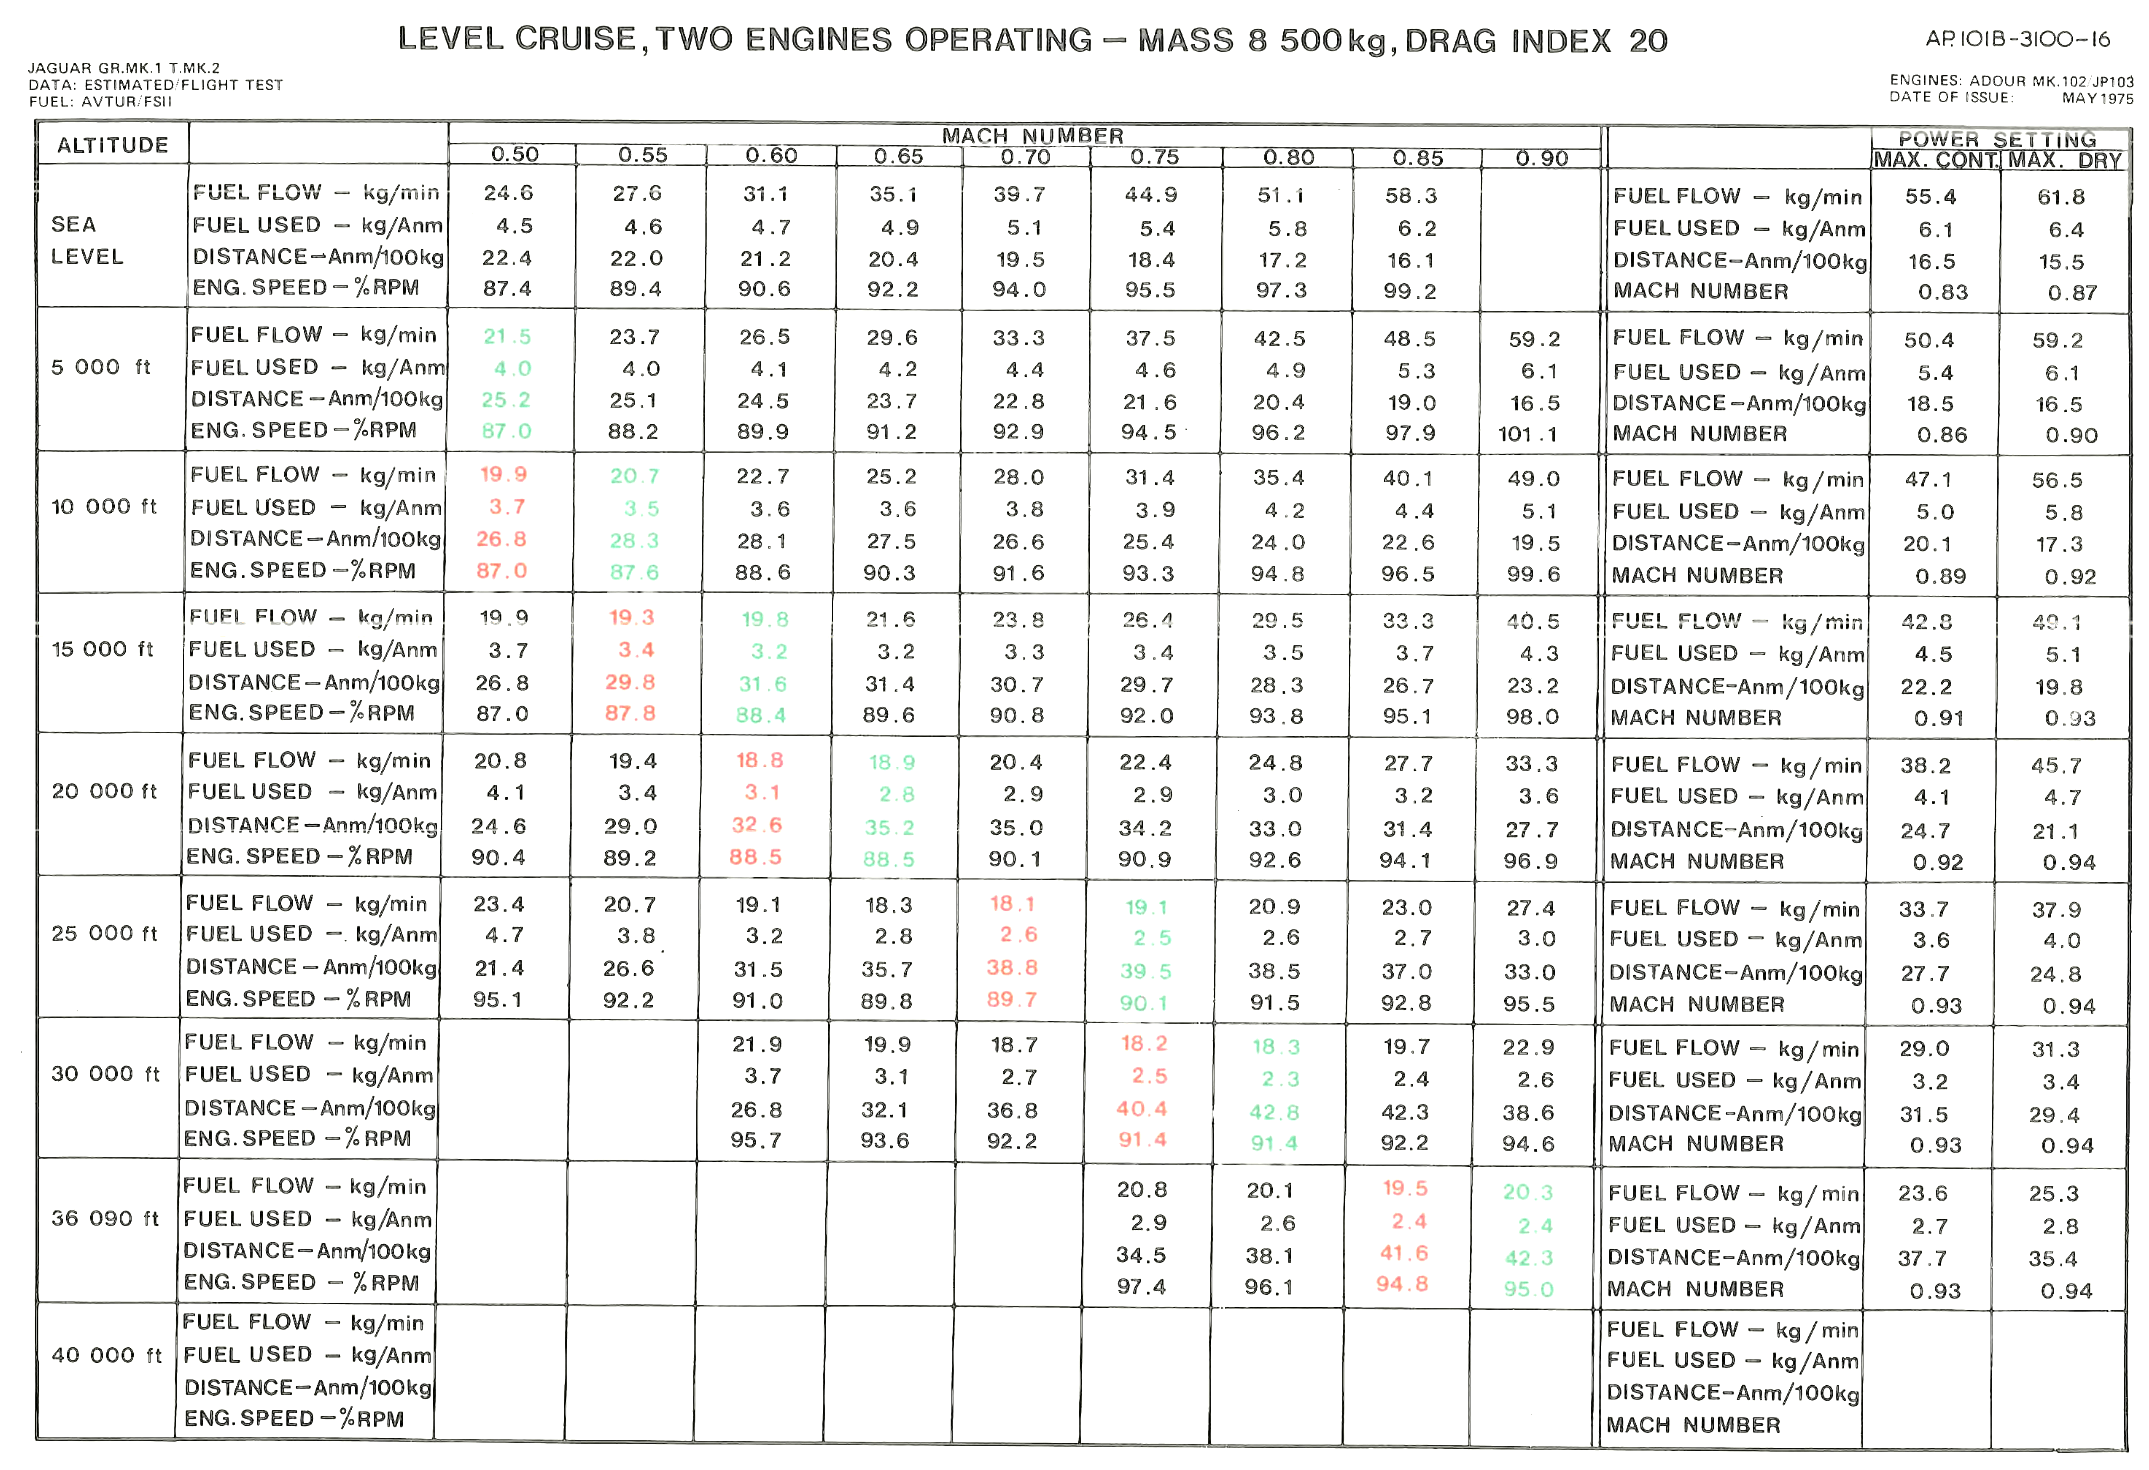
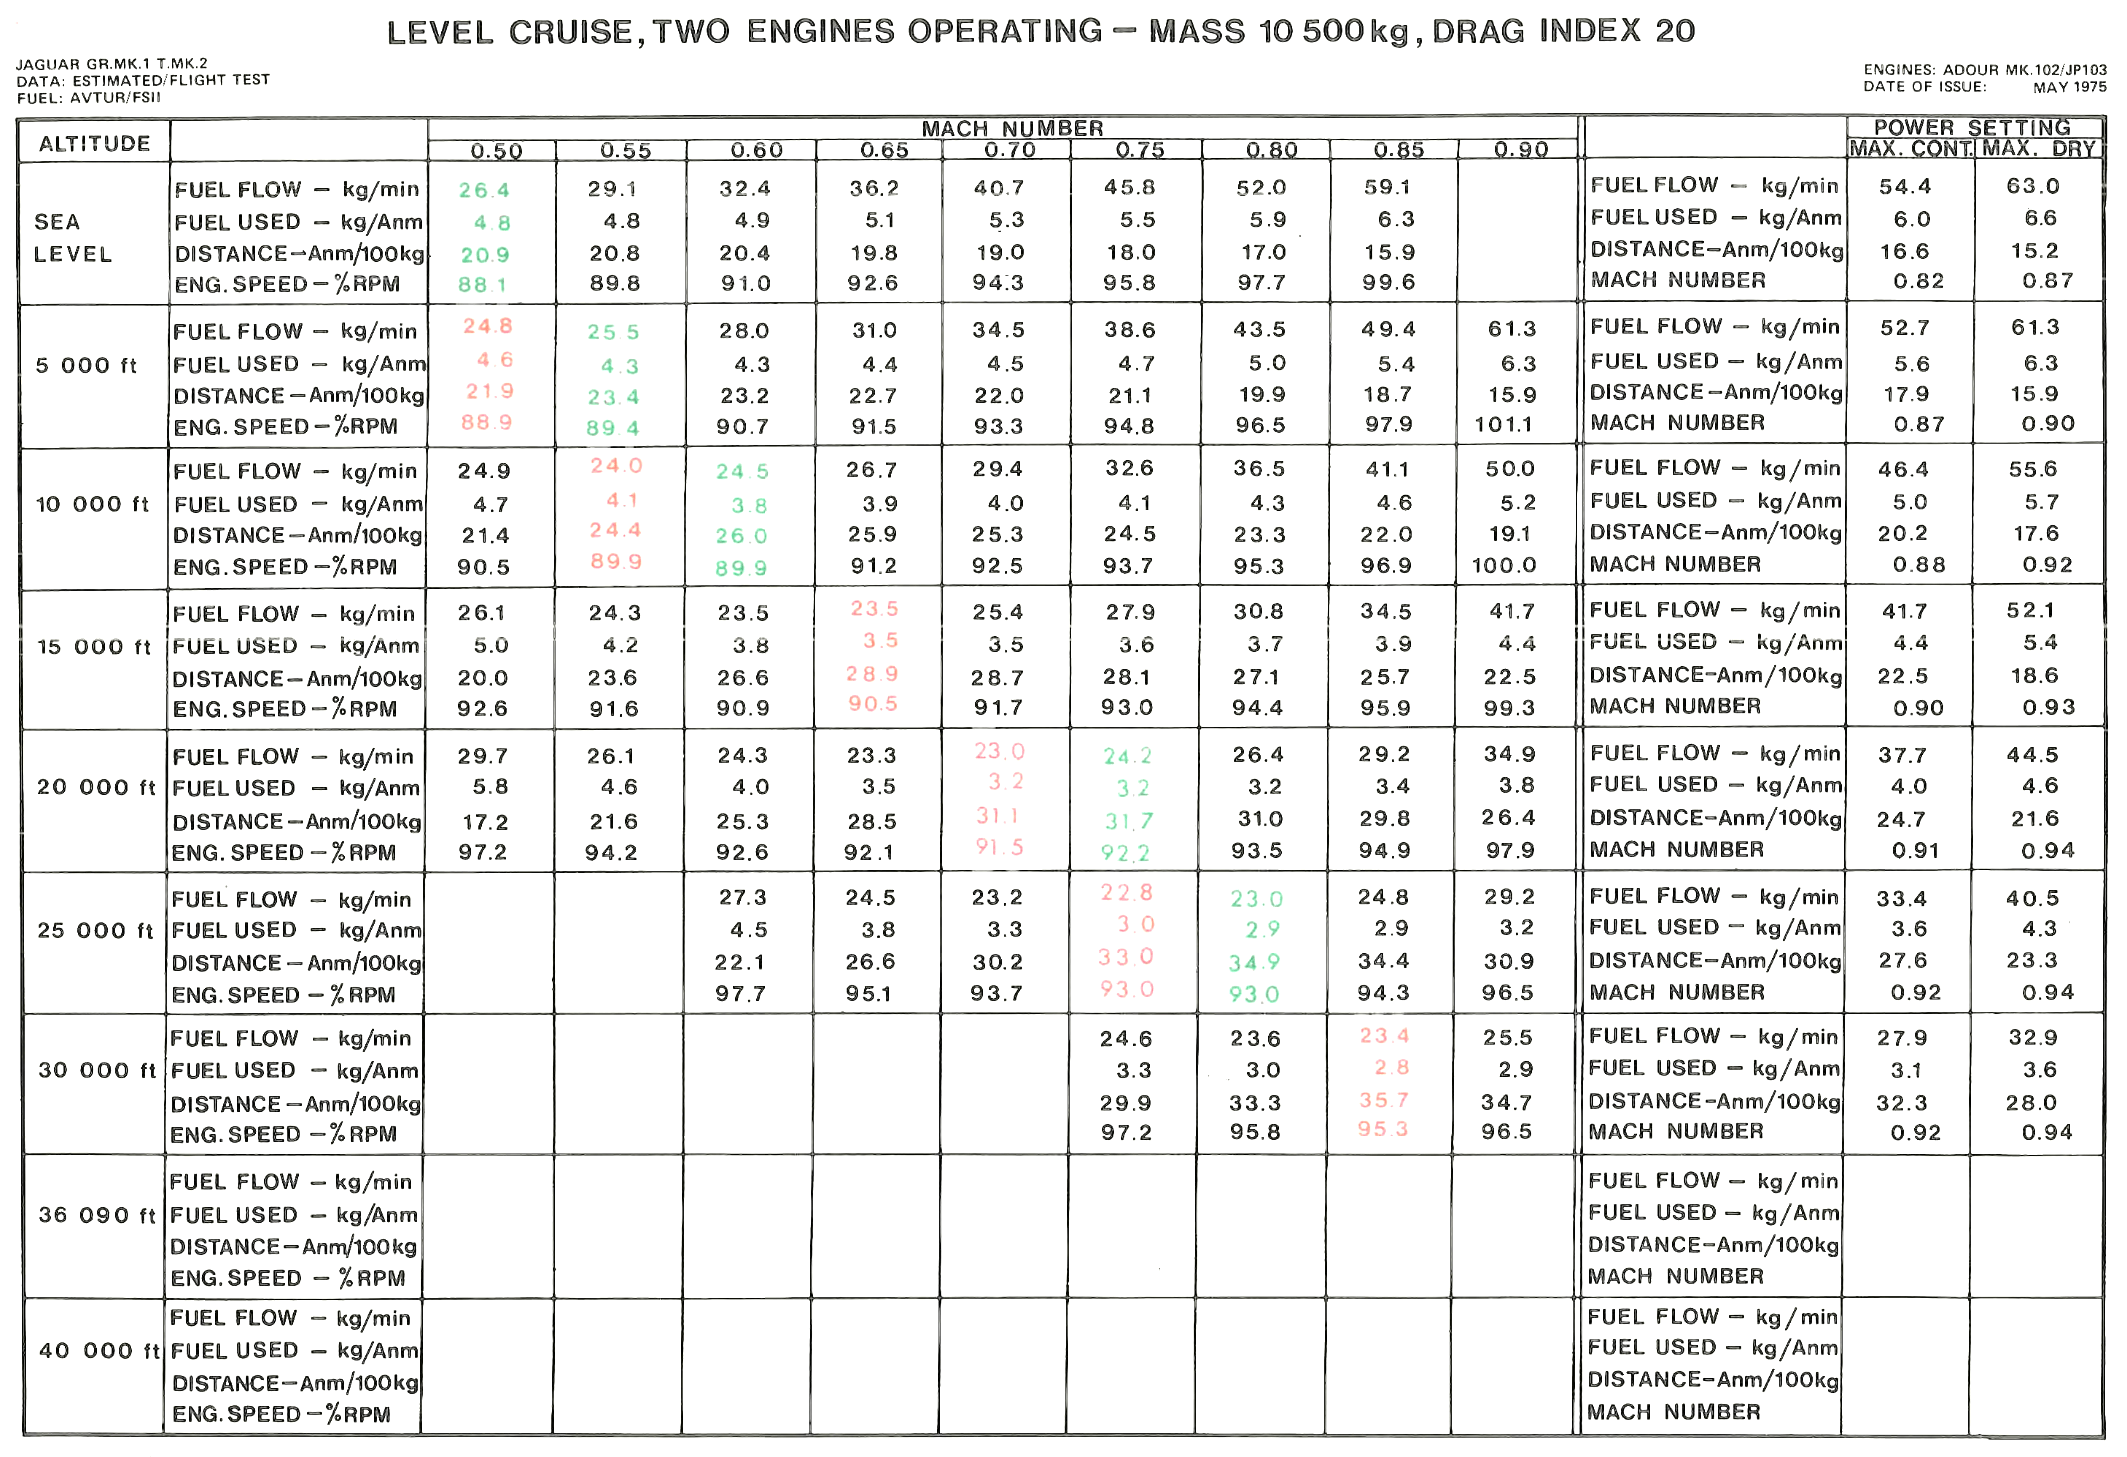
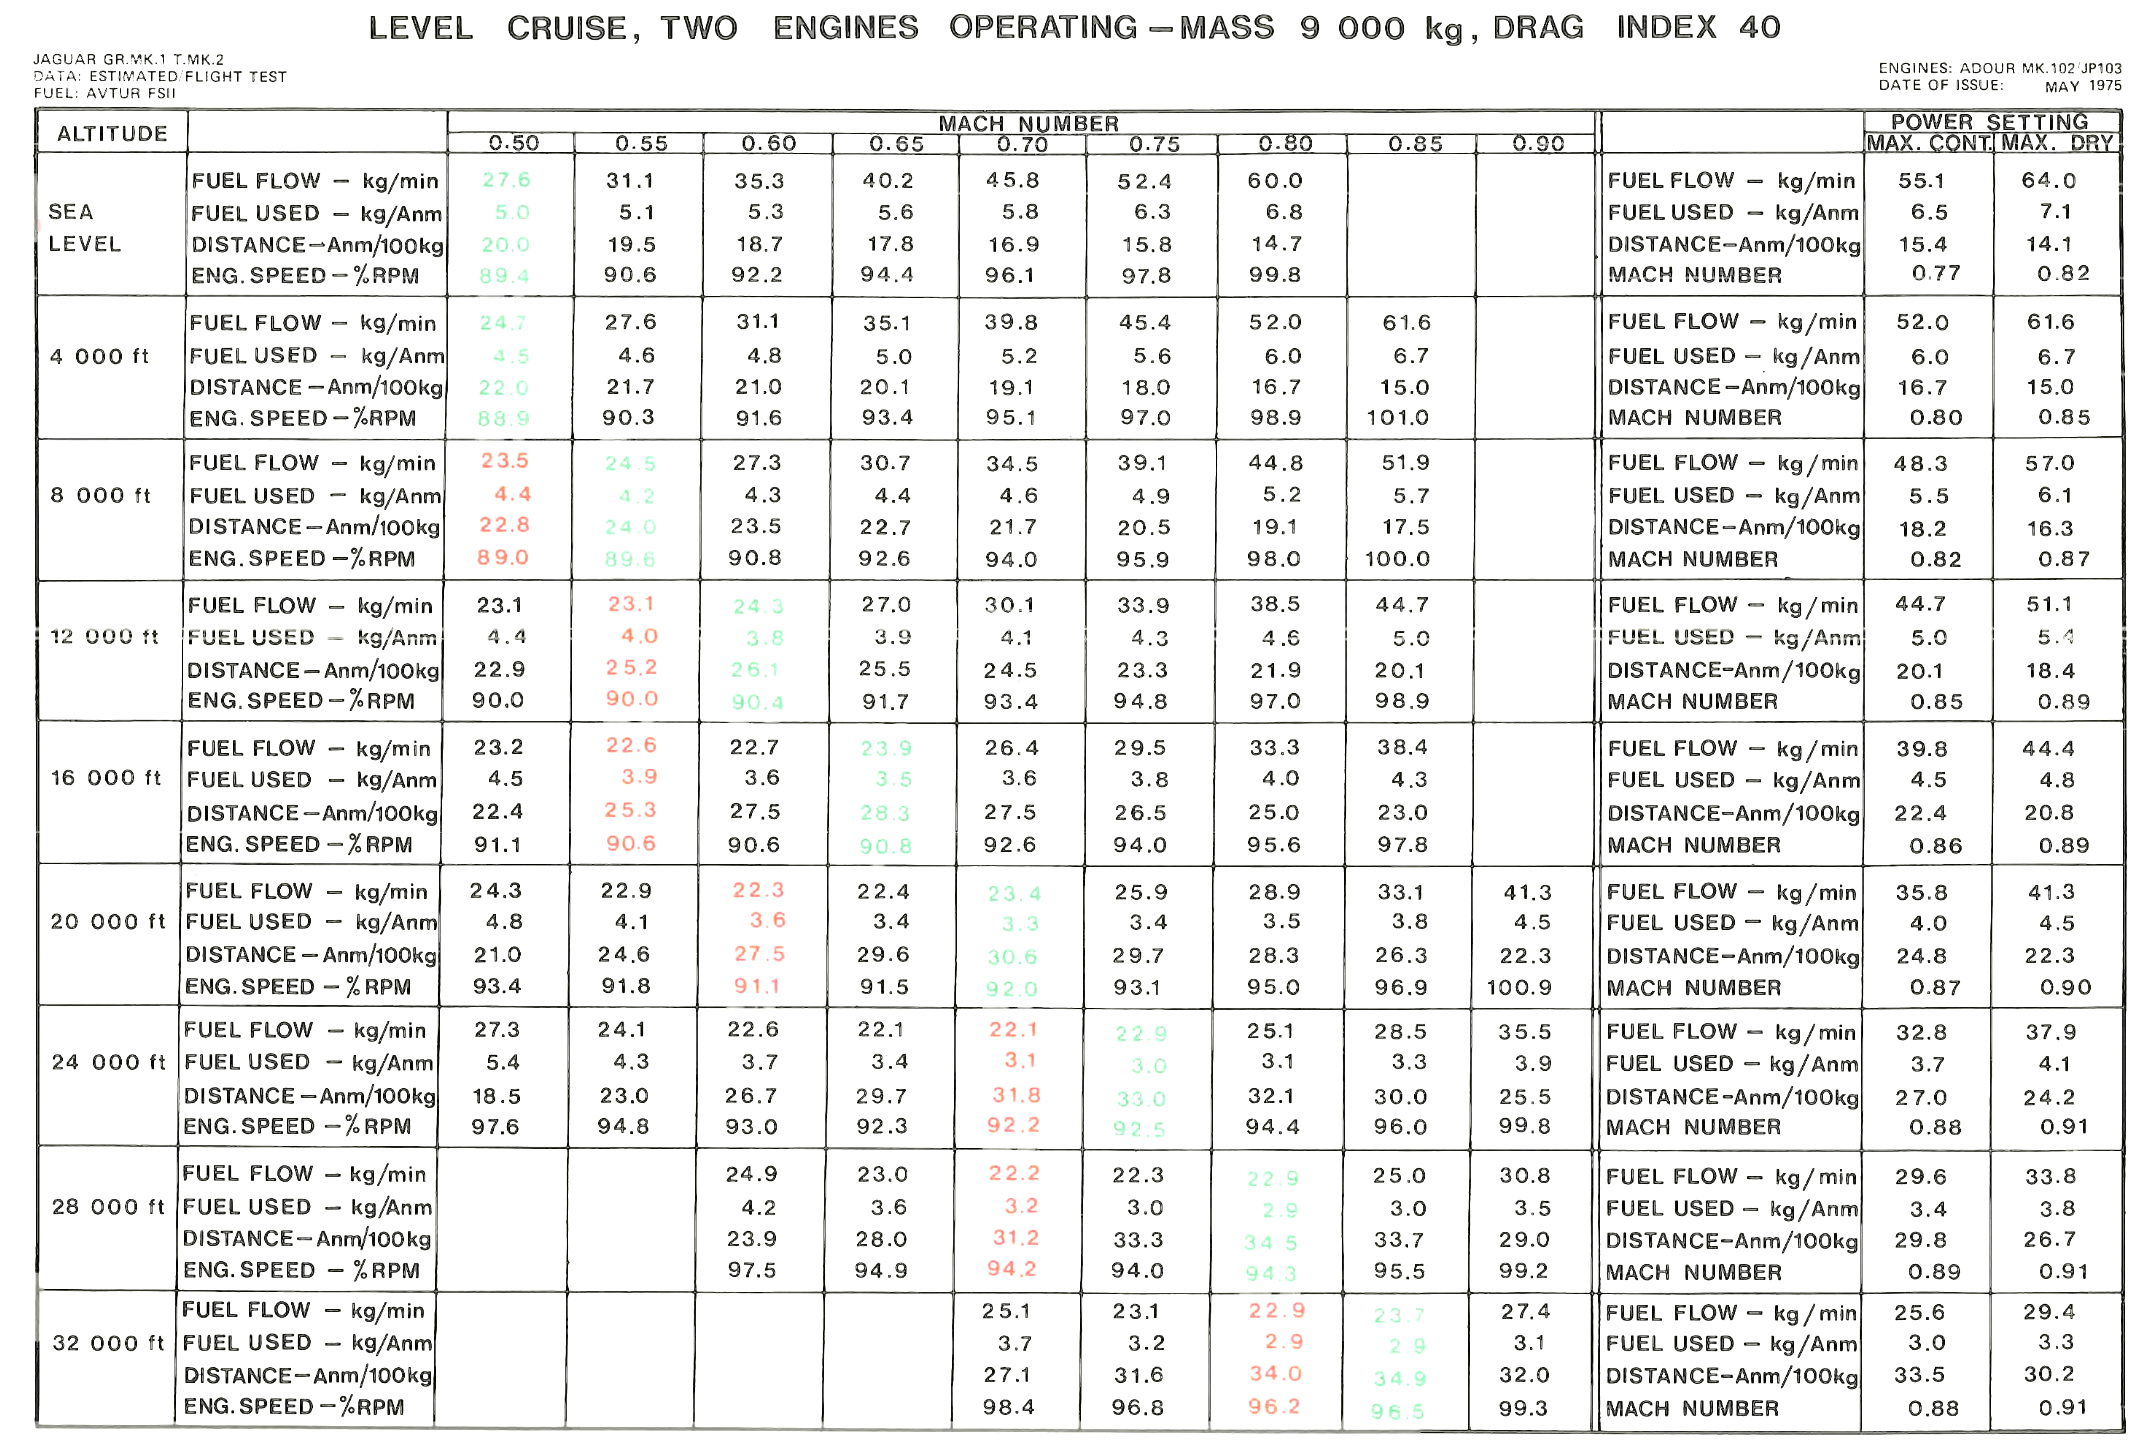
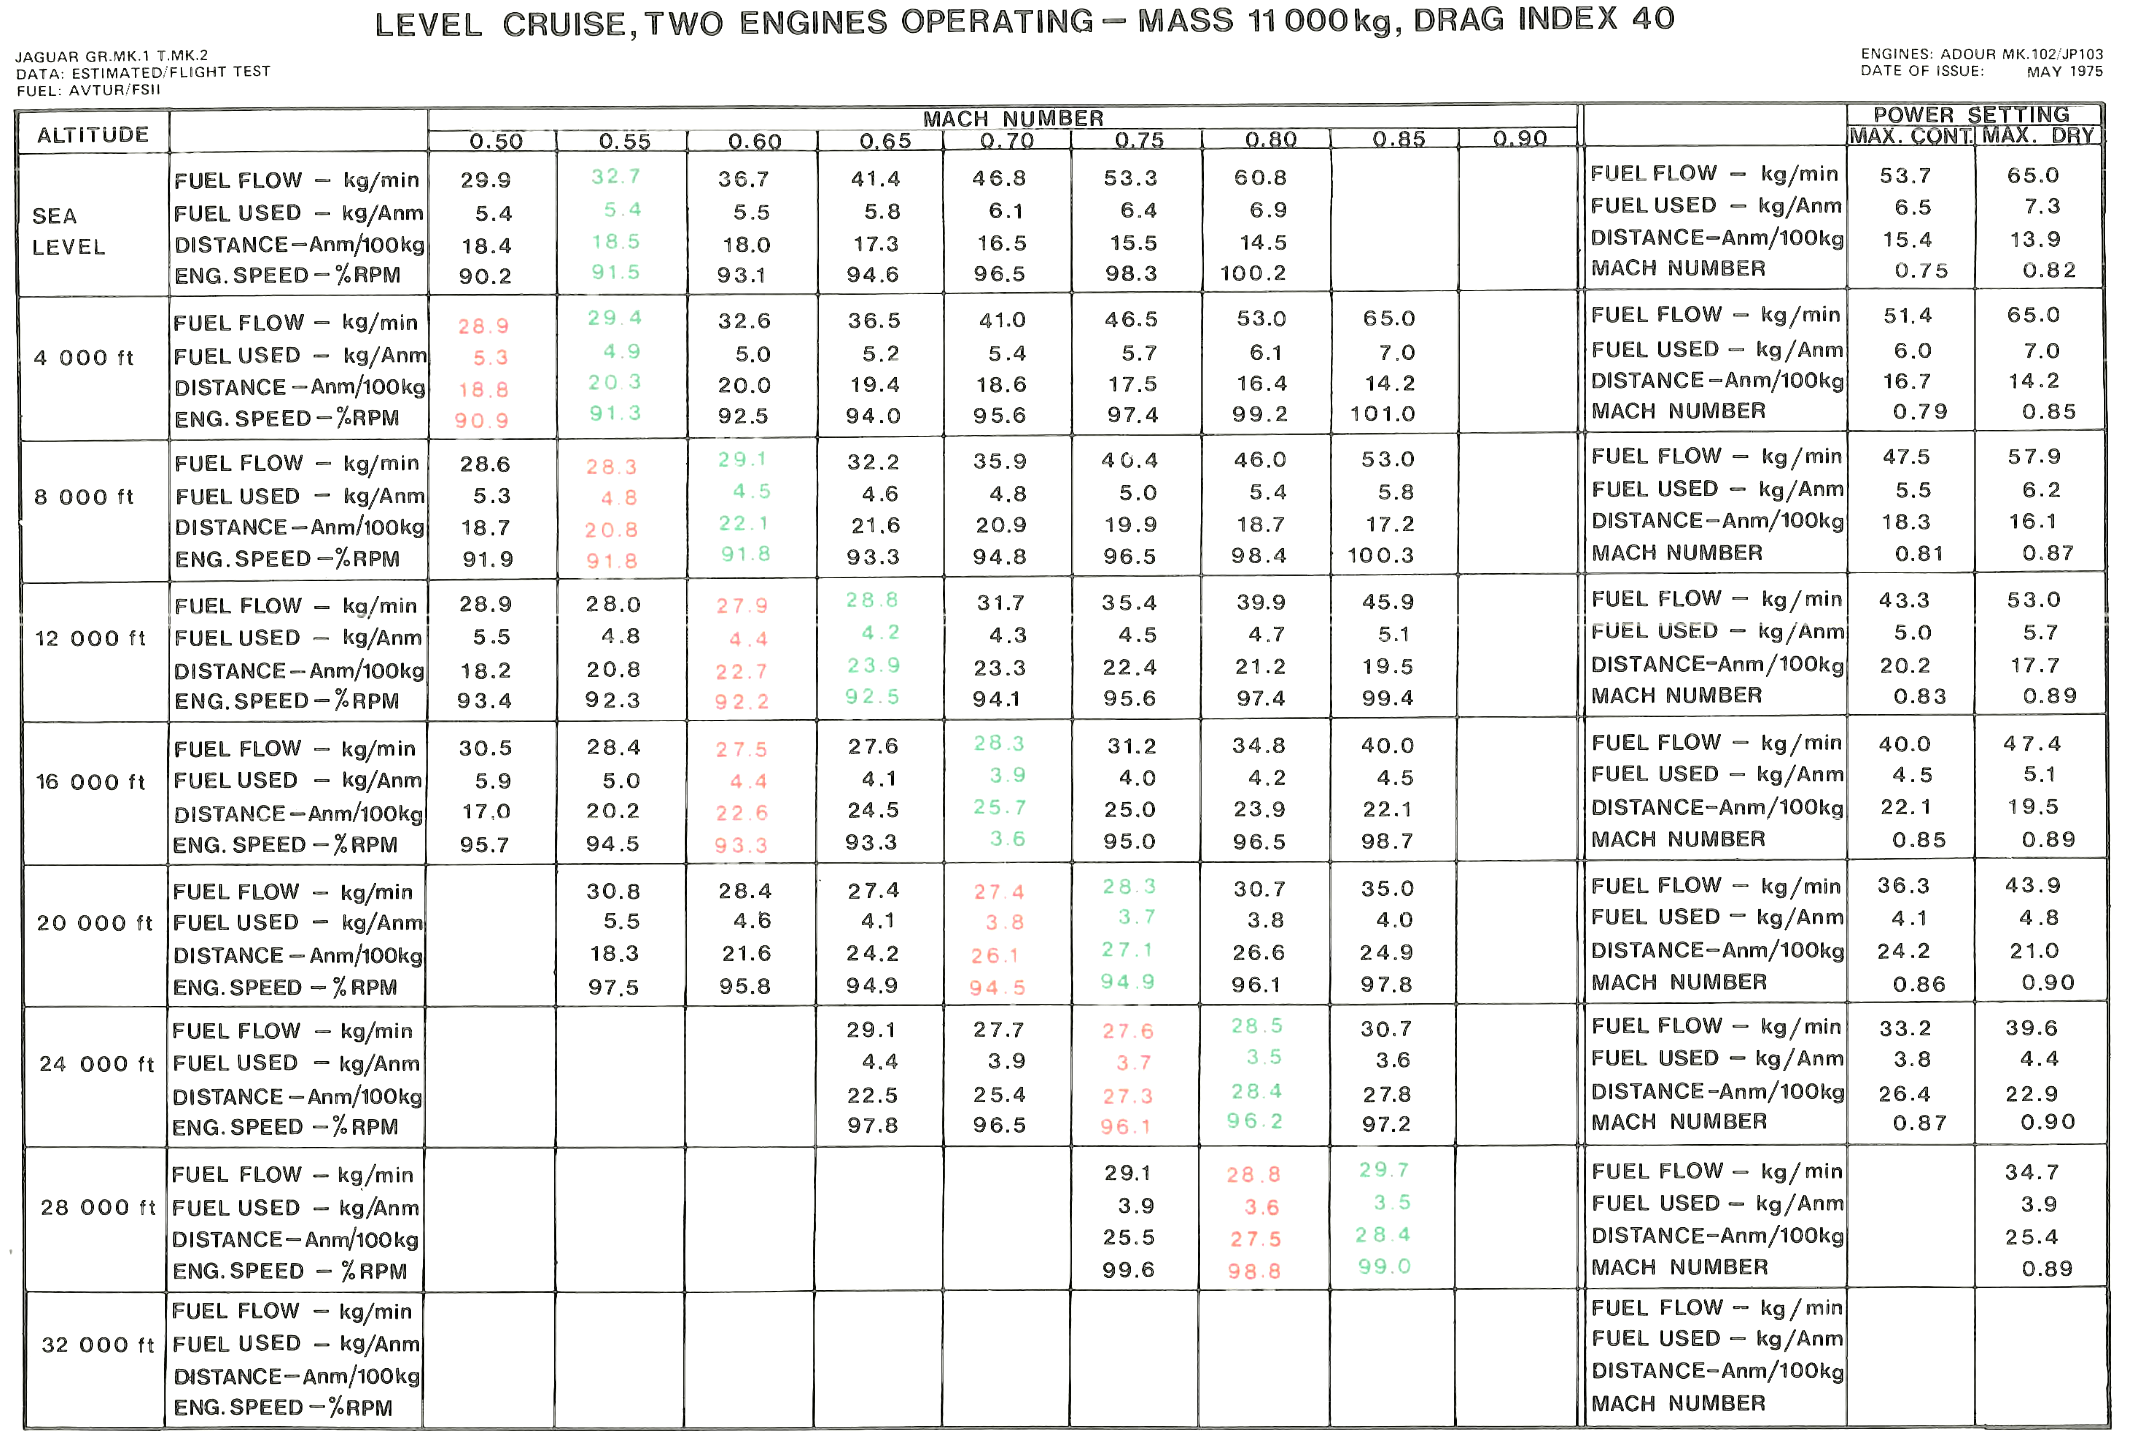
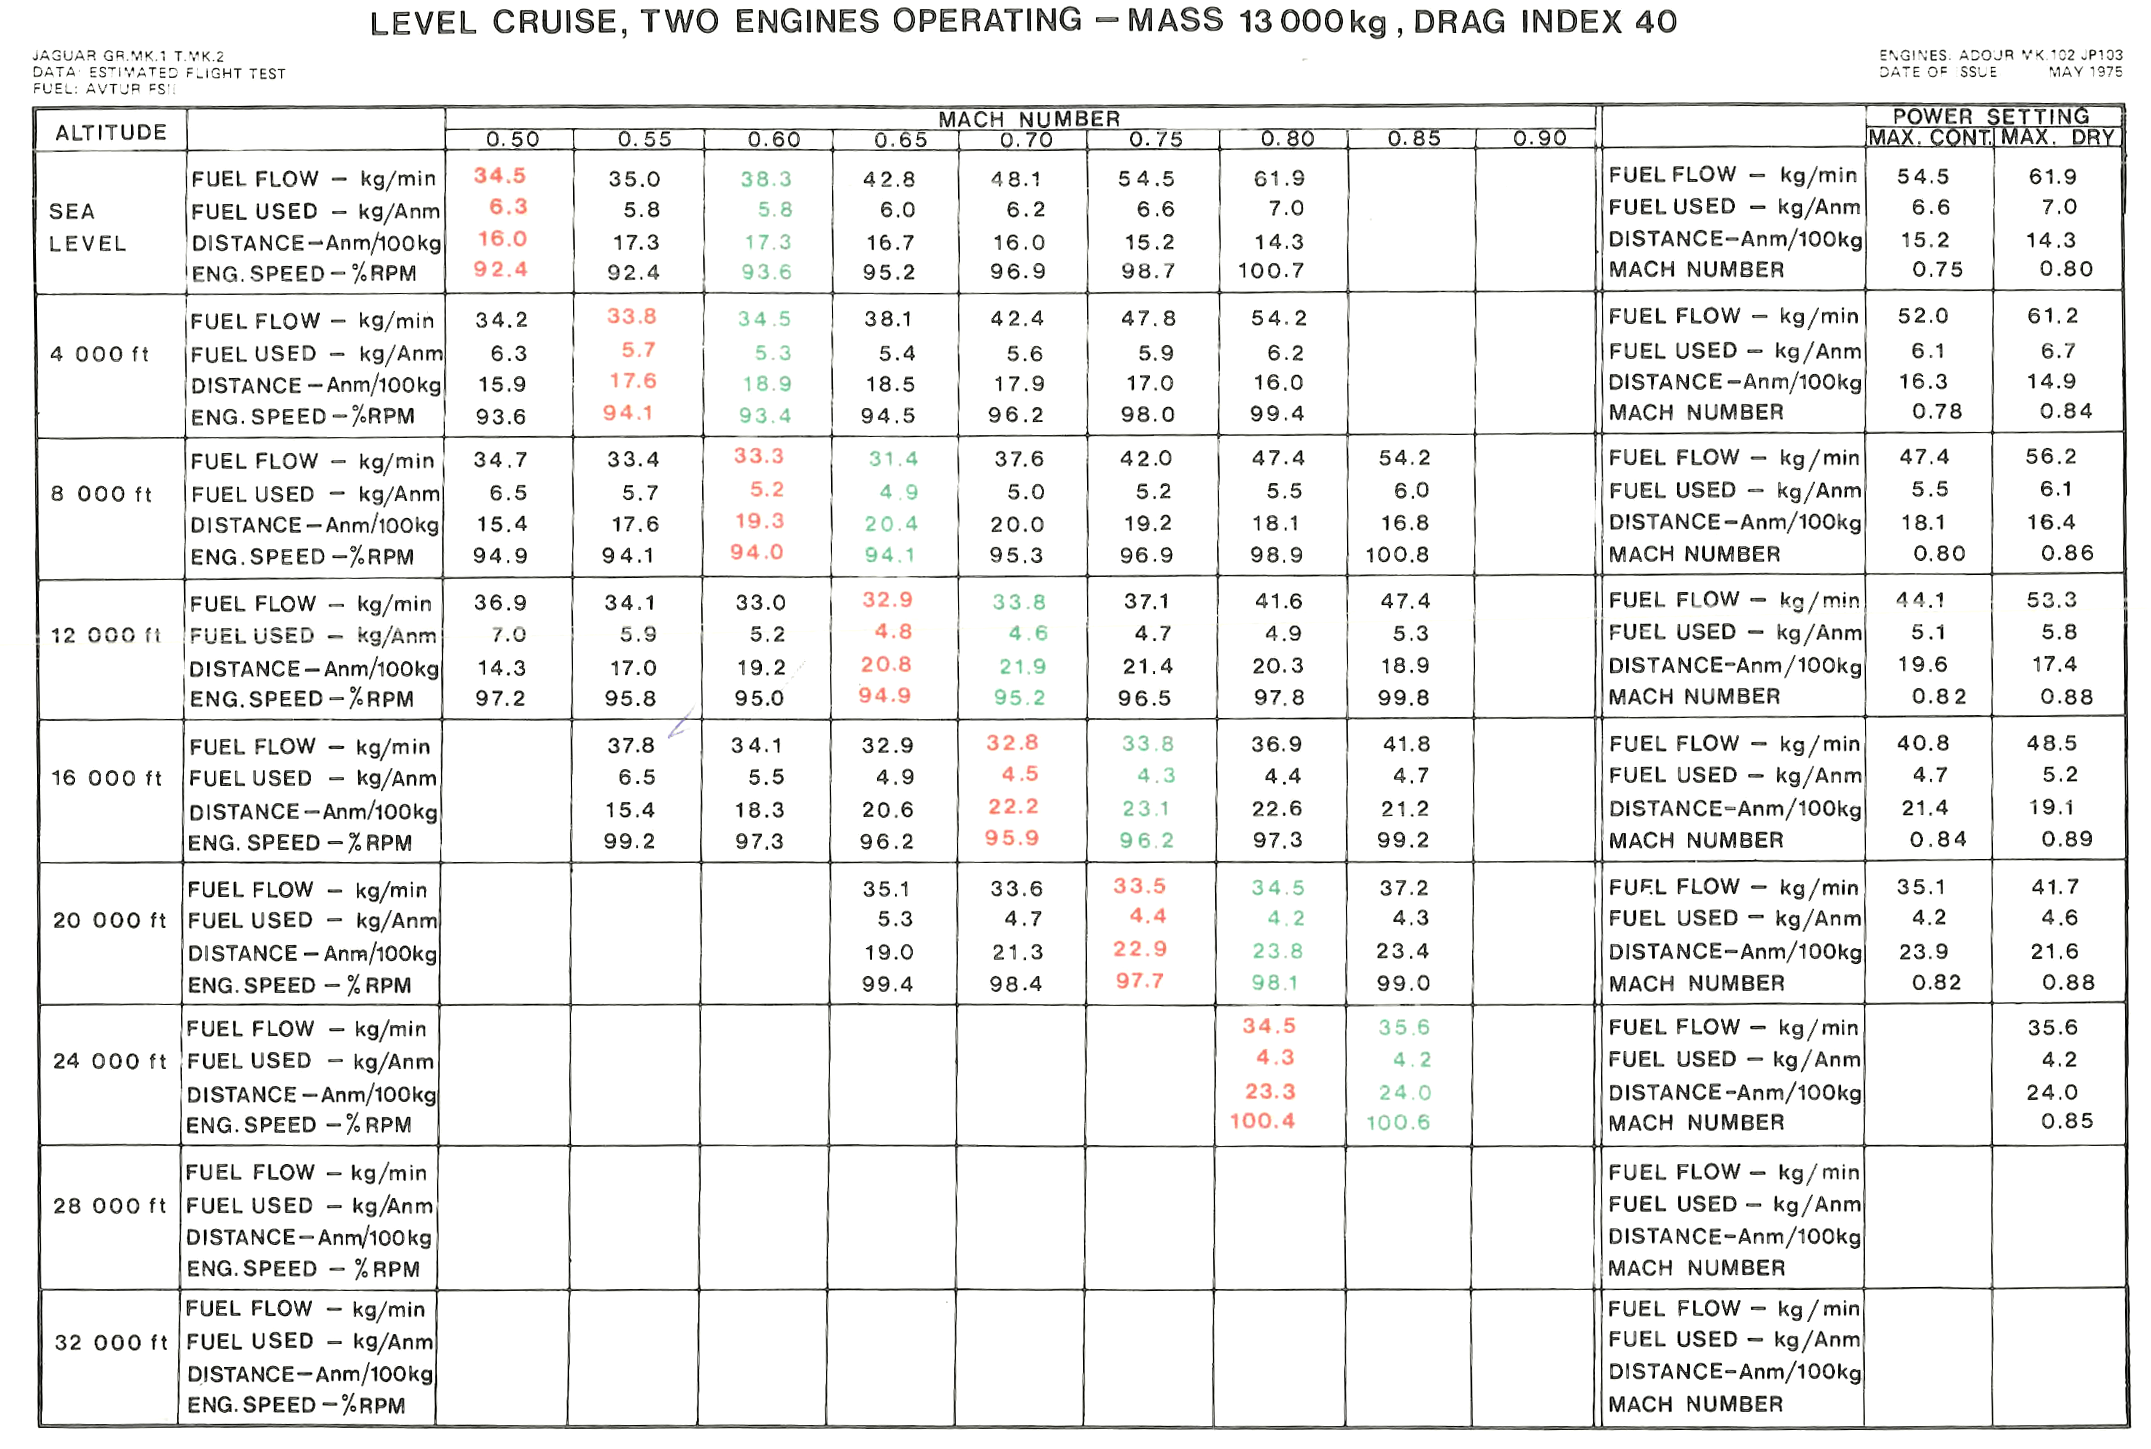
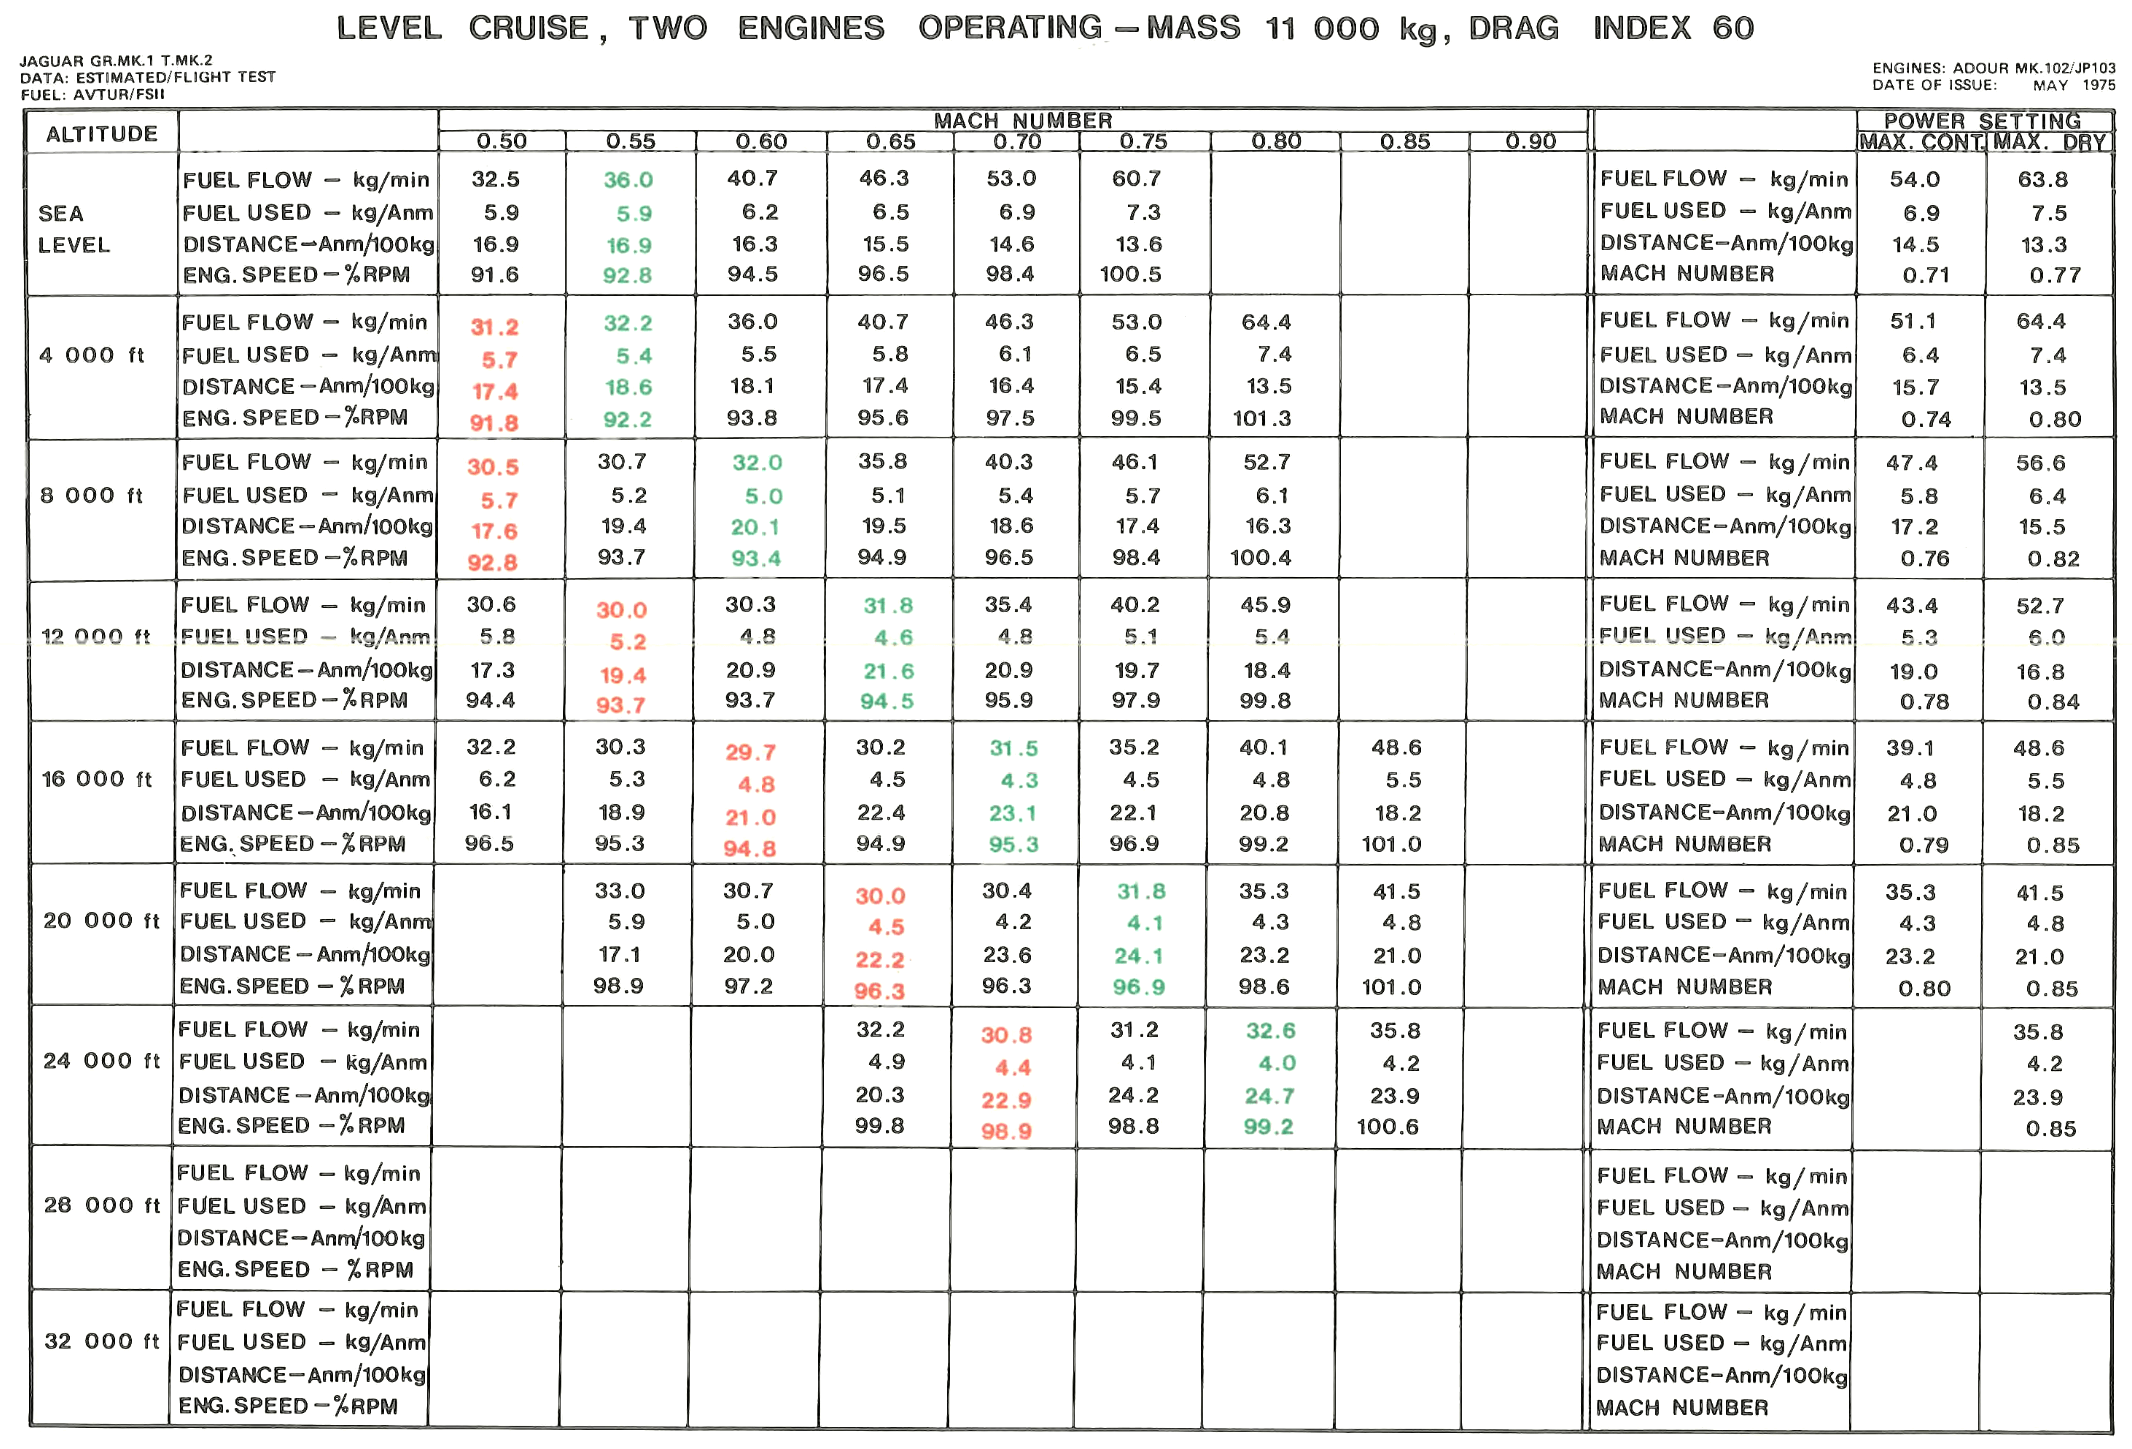
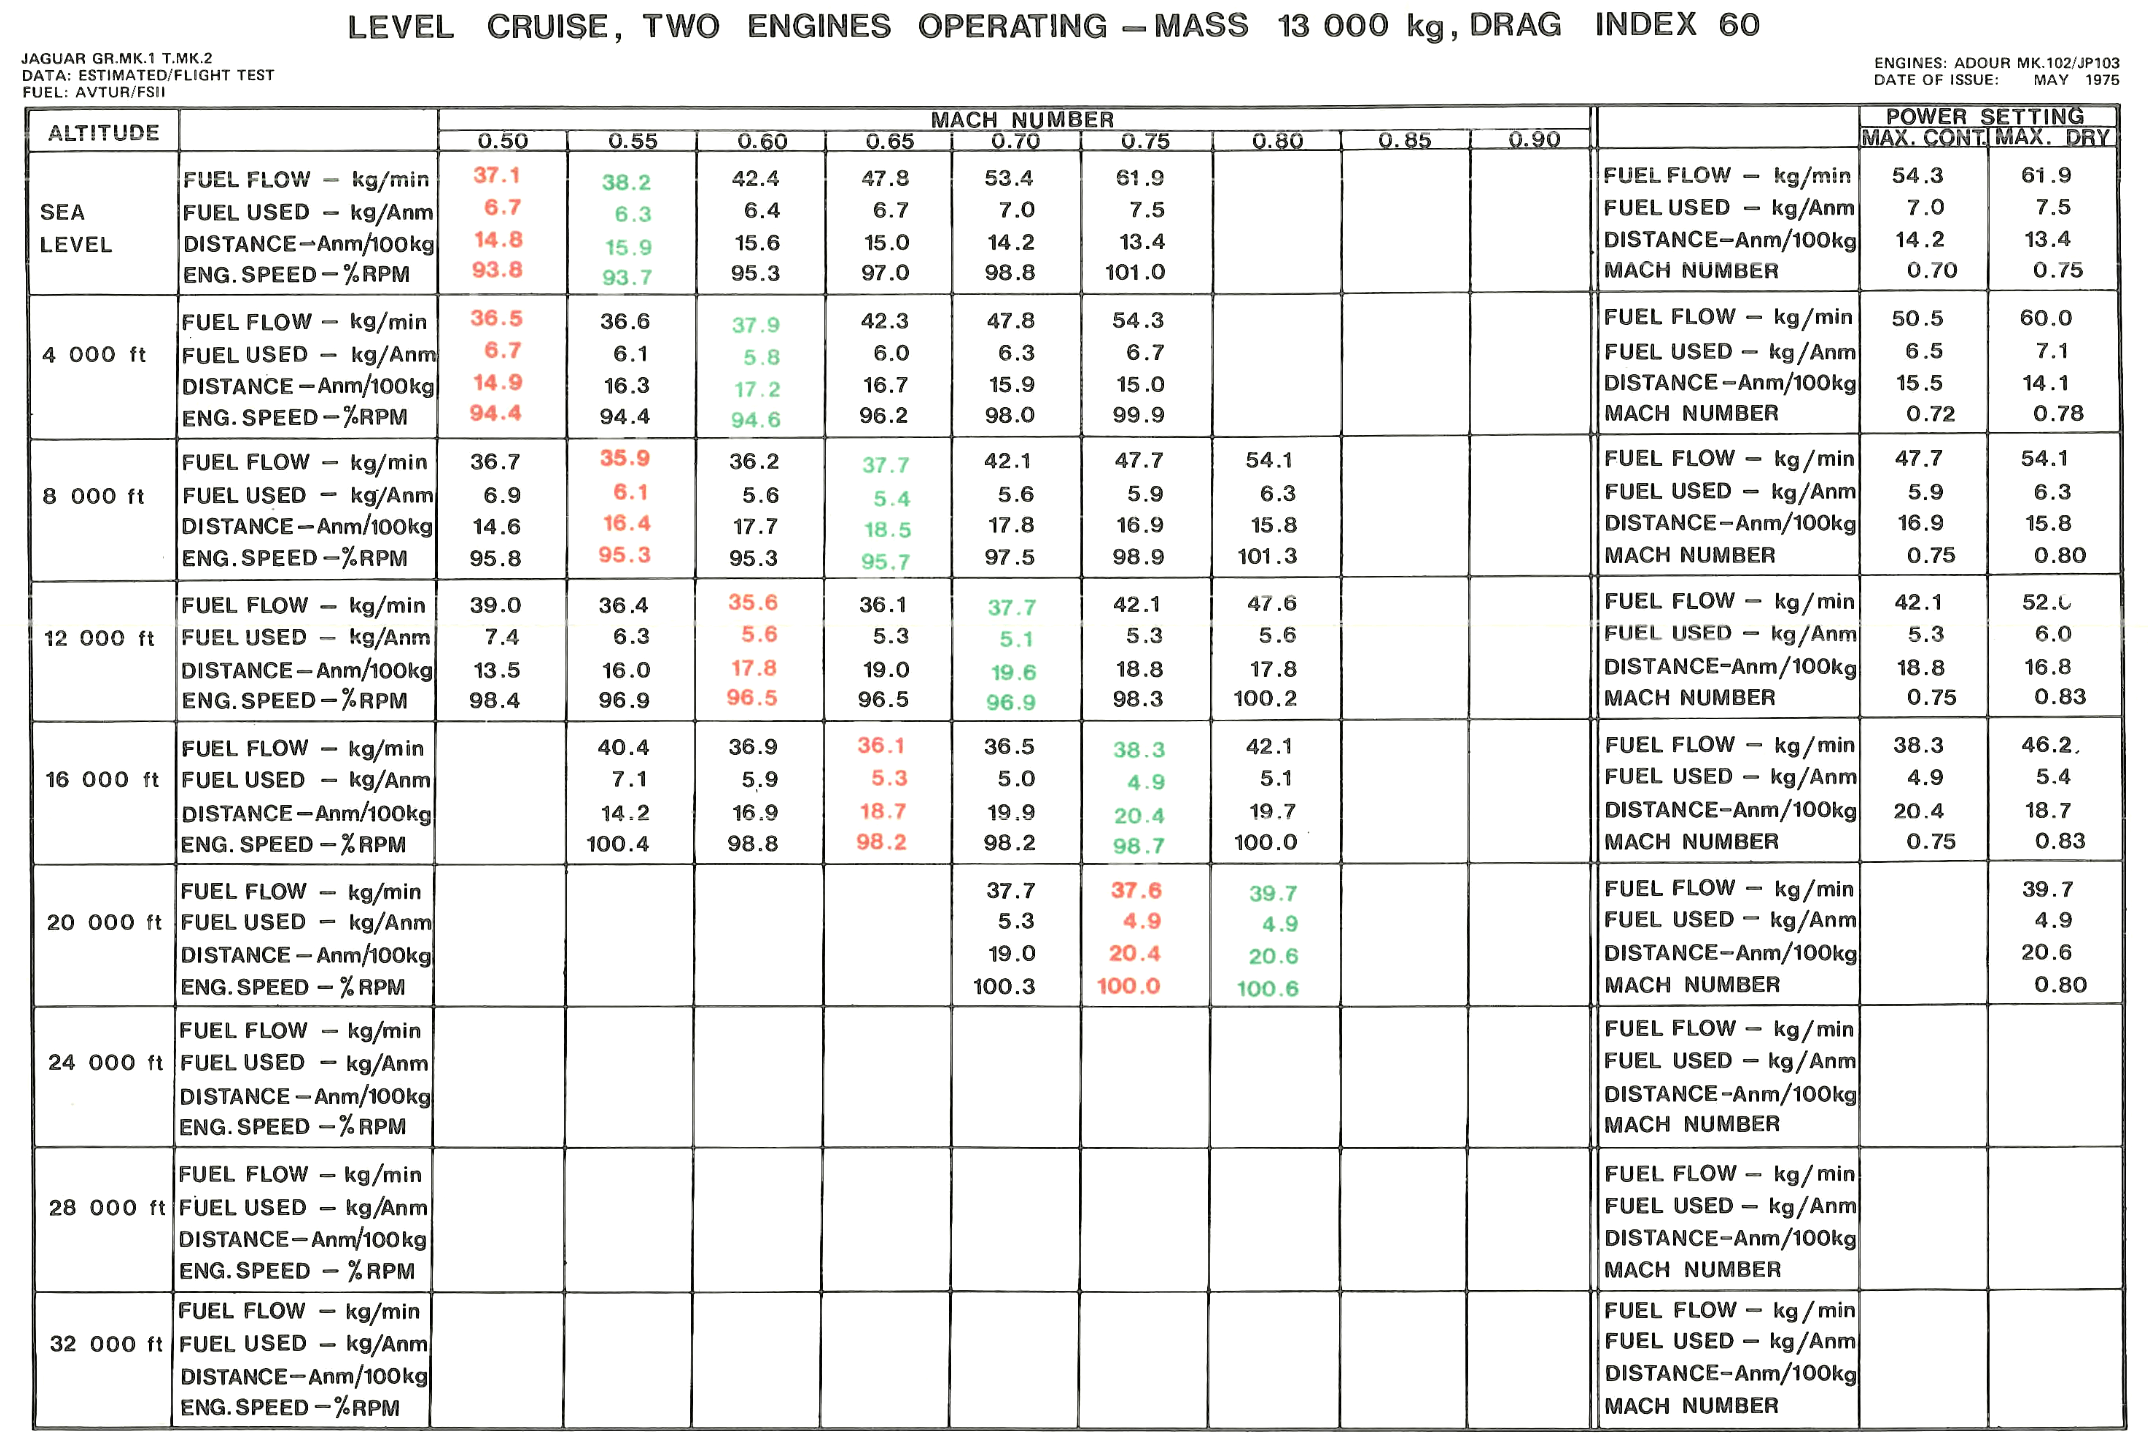
Cruise
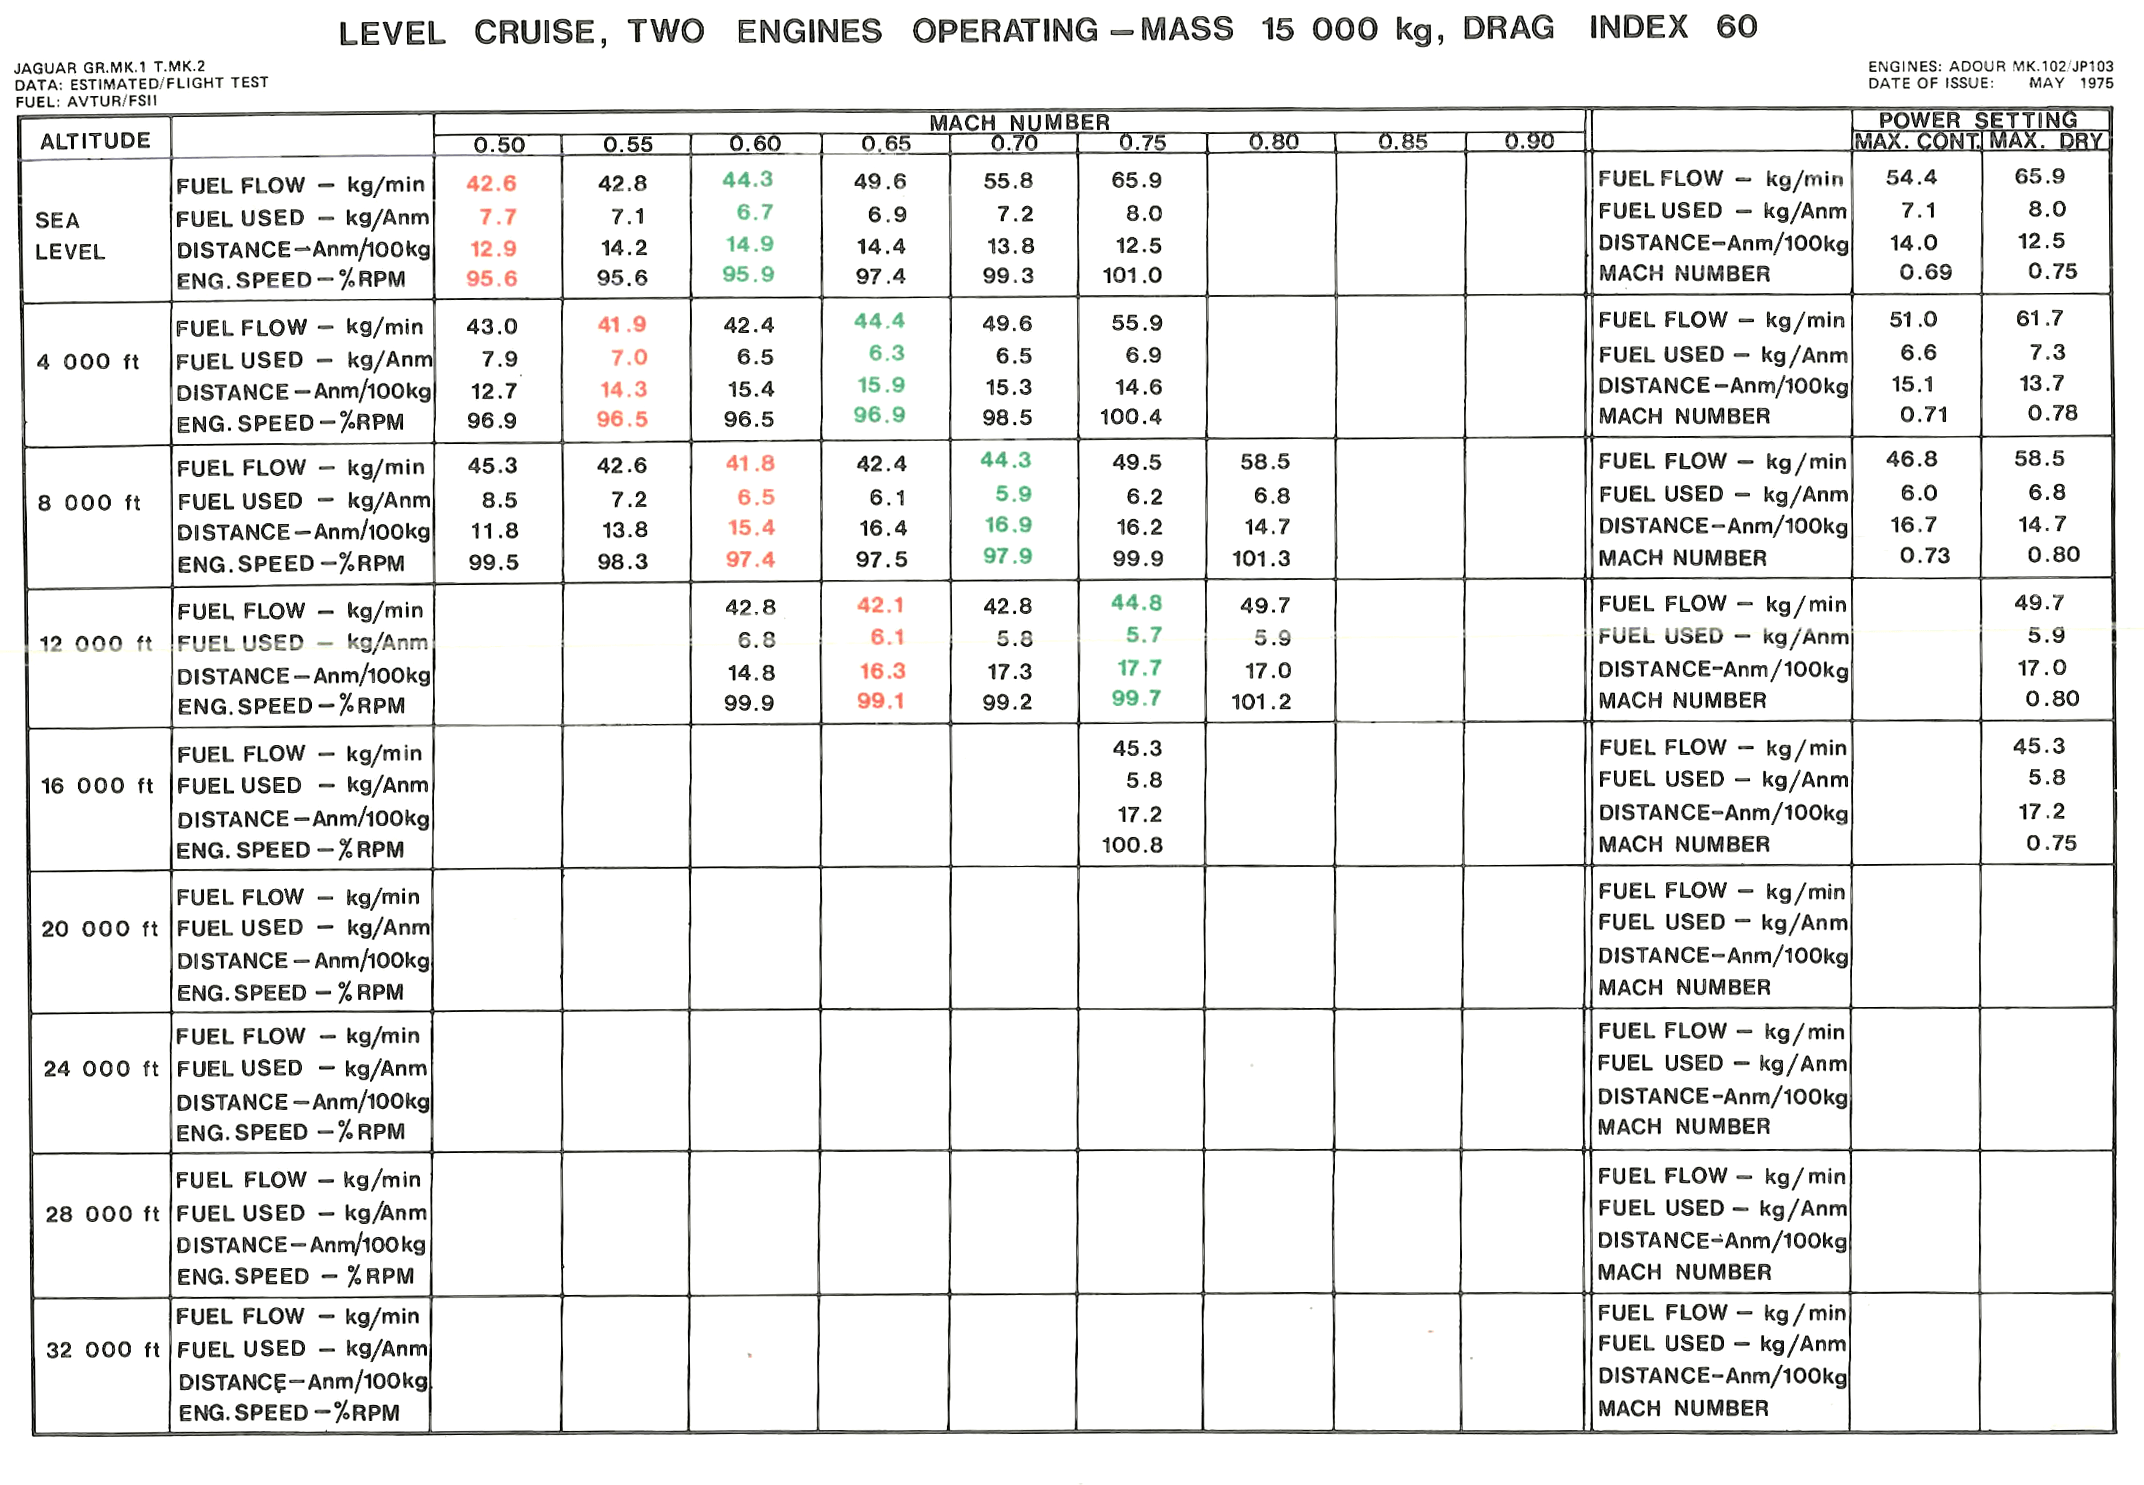
Cruise performance is presented in tabular forms.
Each table shows, for a range of Mach numbers and altitude at constant mass and drag index values, the fuel consumption, the distance travelled per 100 kg of fuel used, and the percentage HP compressor speed (% RPM).
At each altitude, the Mach number giving maximum endurance is shown in red and that giving maximum range, in green.

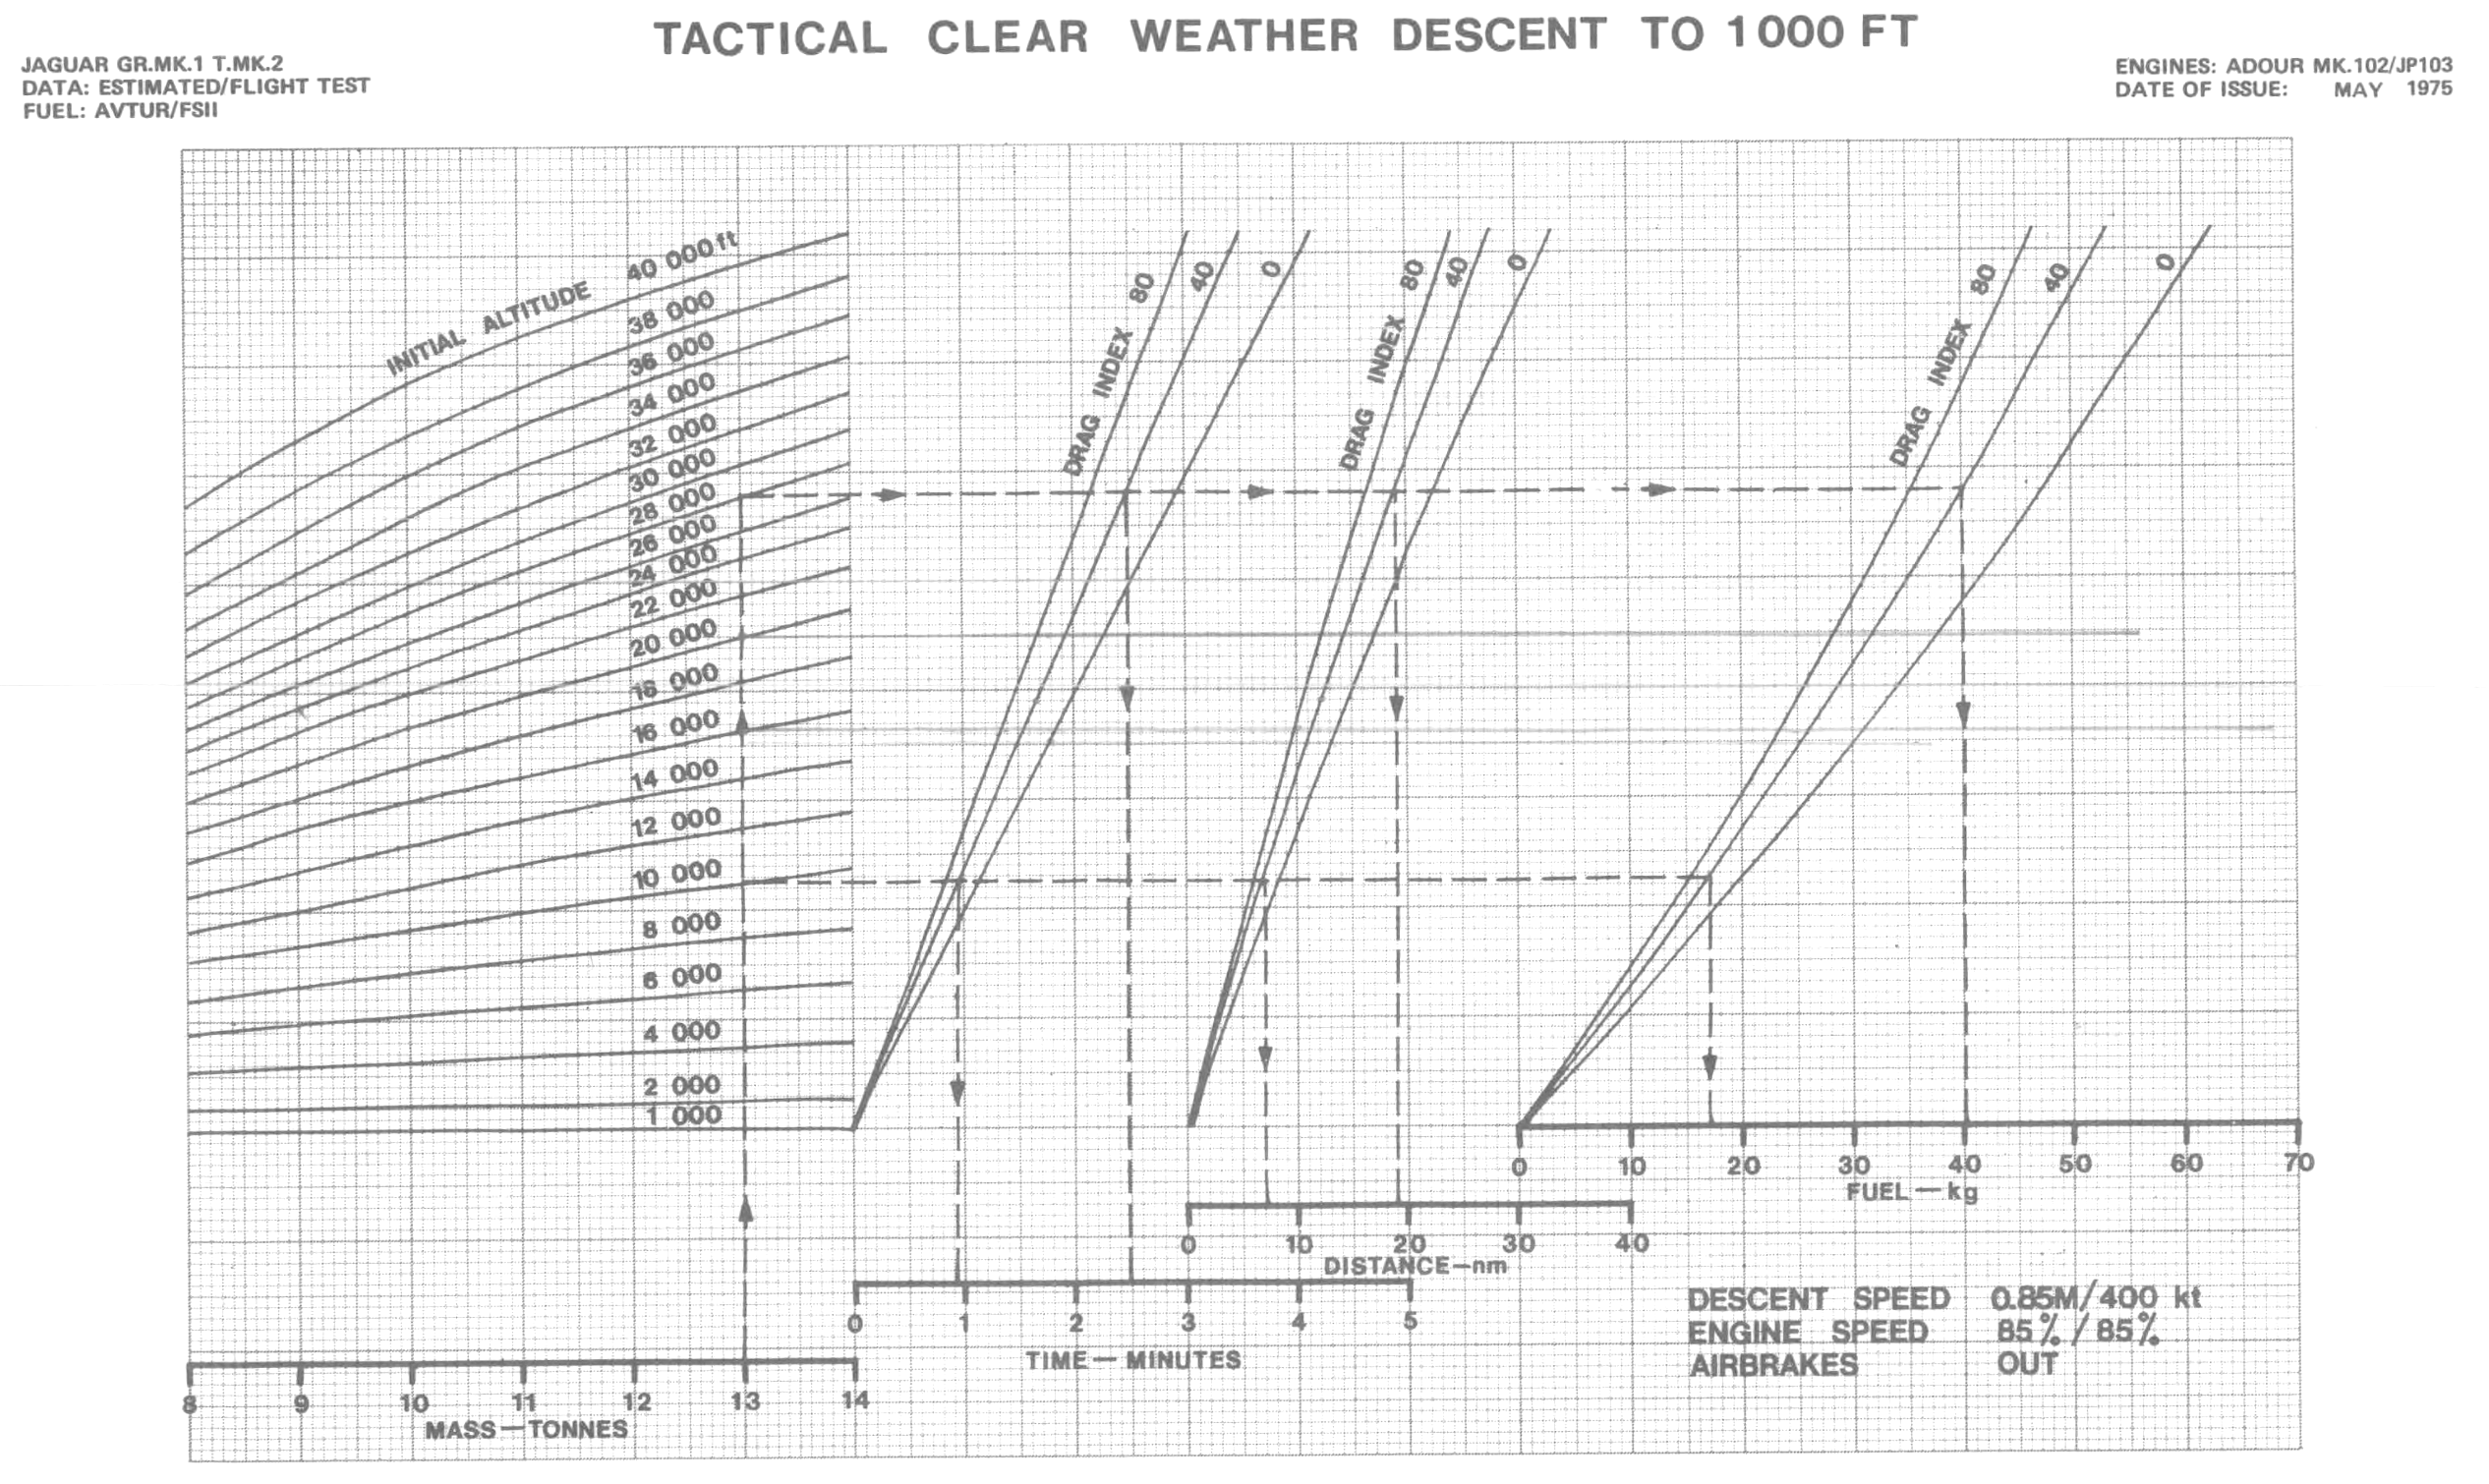
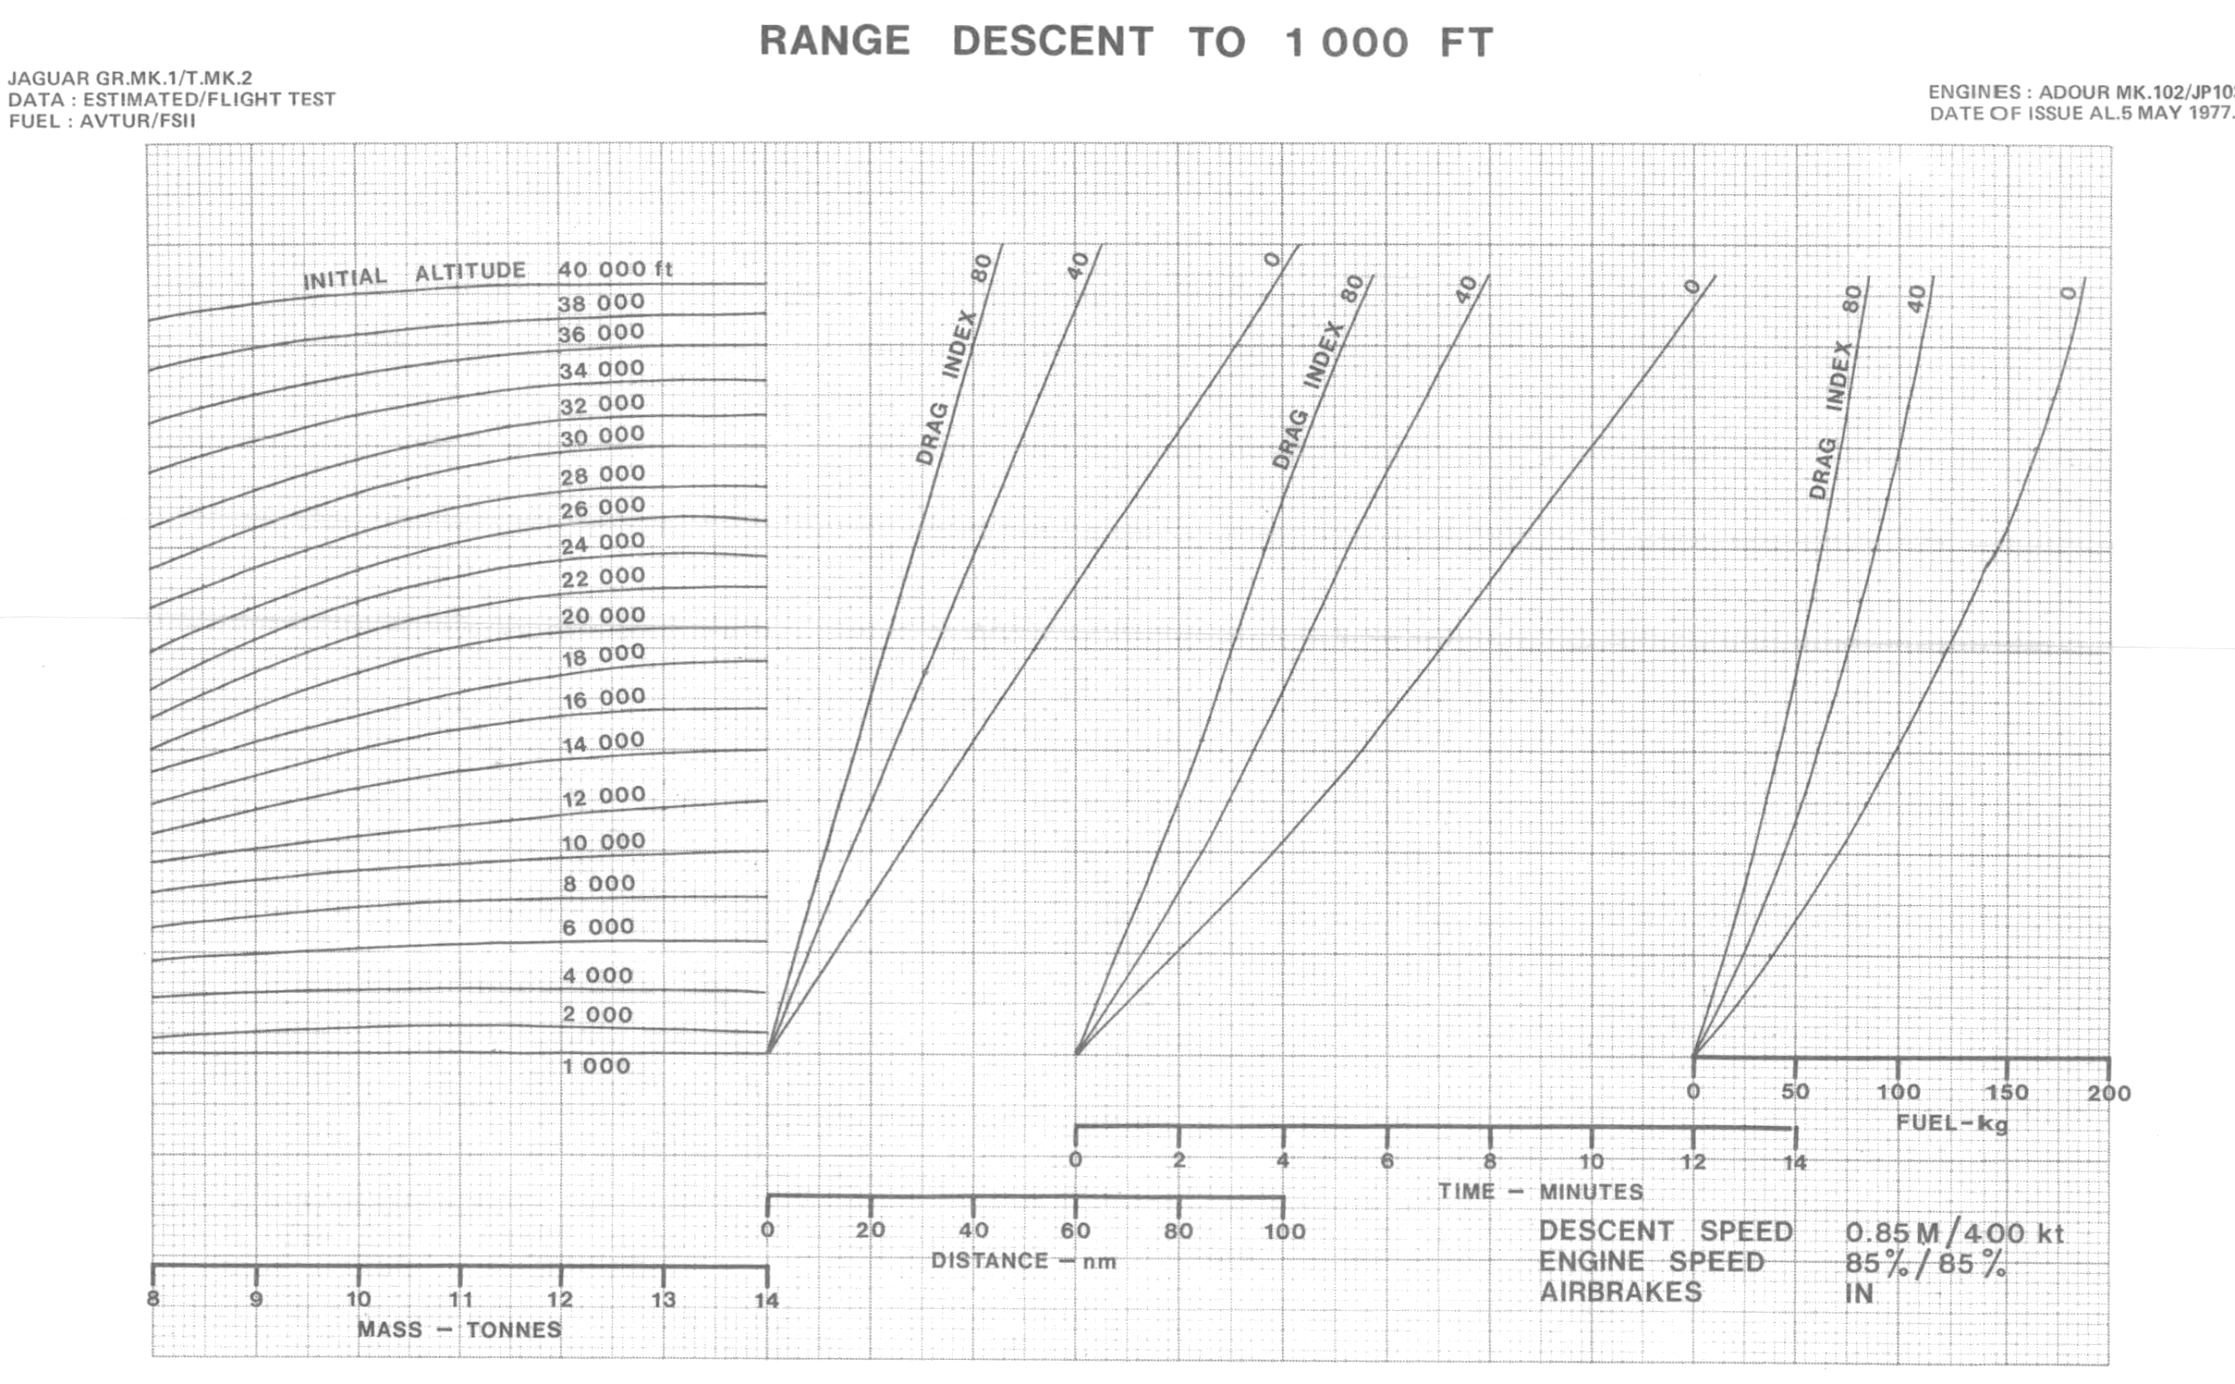
Descent
Time, distance and fuel used for descents to 1000 ft are presented as functions of mass, initial altitude and drag index value. Data for descents to intermediate altitudes are obtained by subtraction.
The effect of ambient temperature on descend performance is negligible.
One chart shows tactical descent with airbrakes out, the other one without airbrakes.
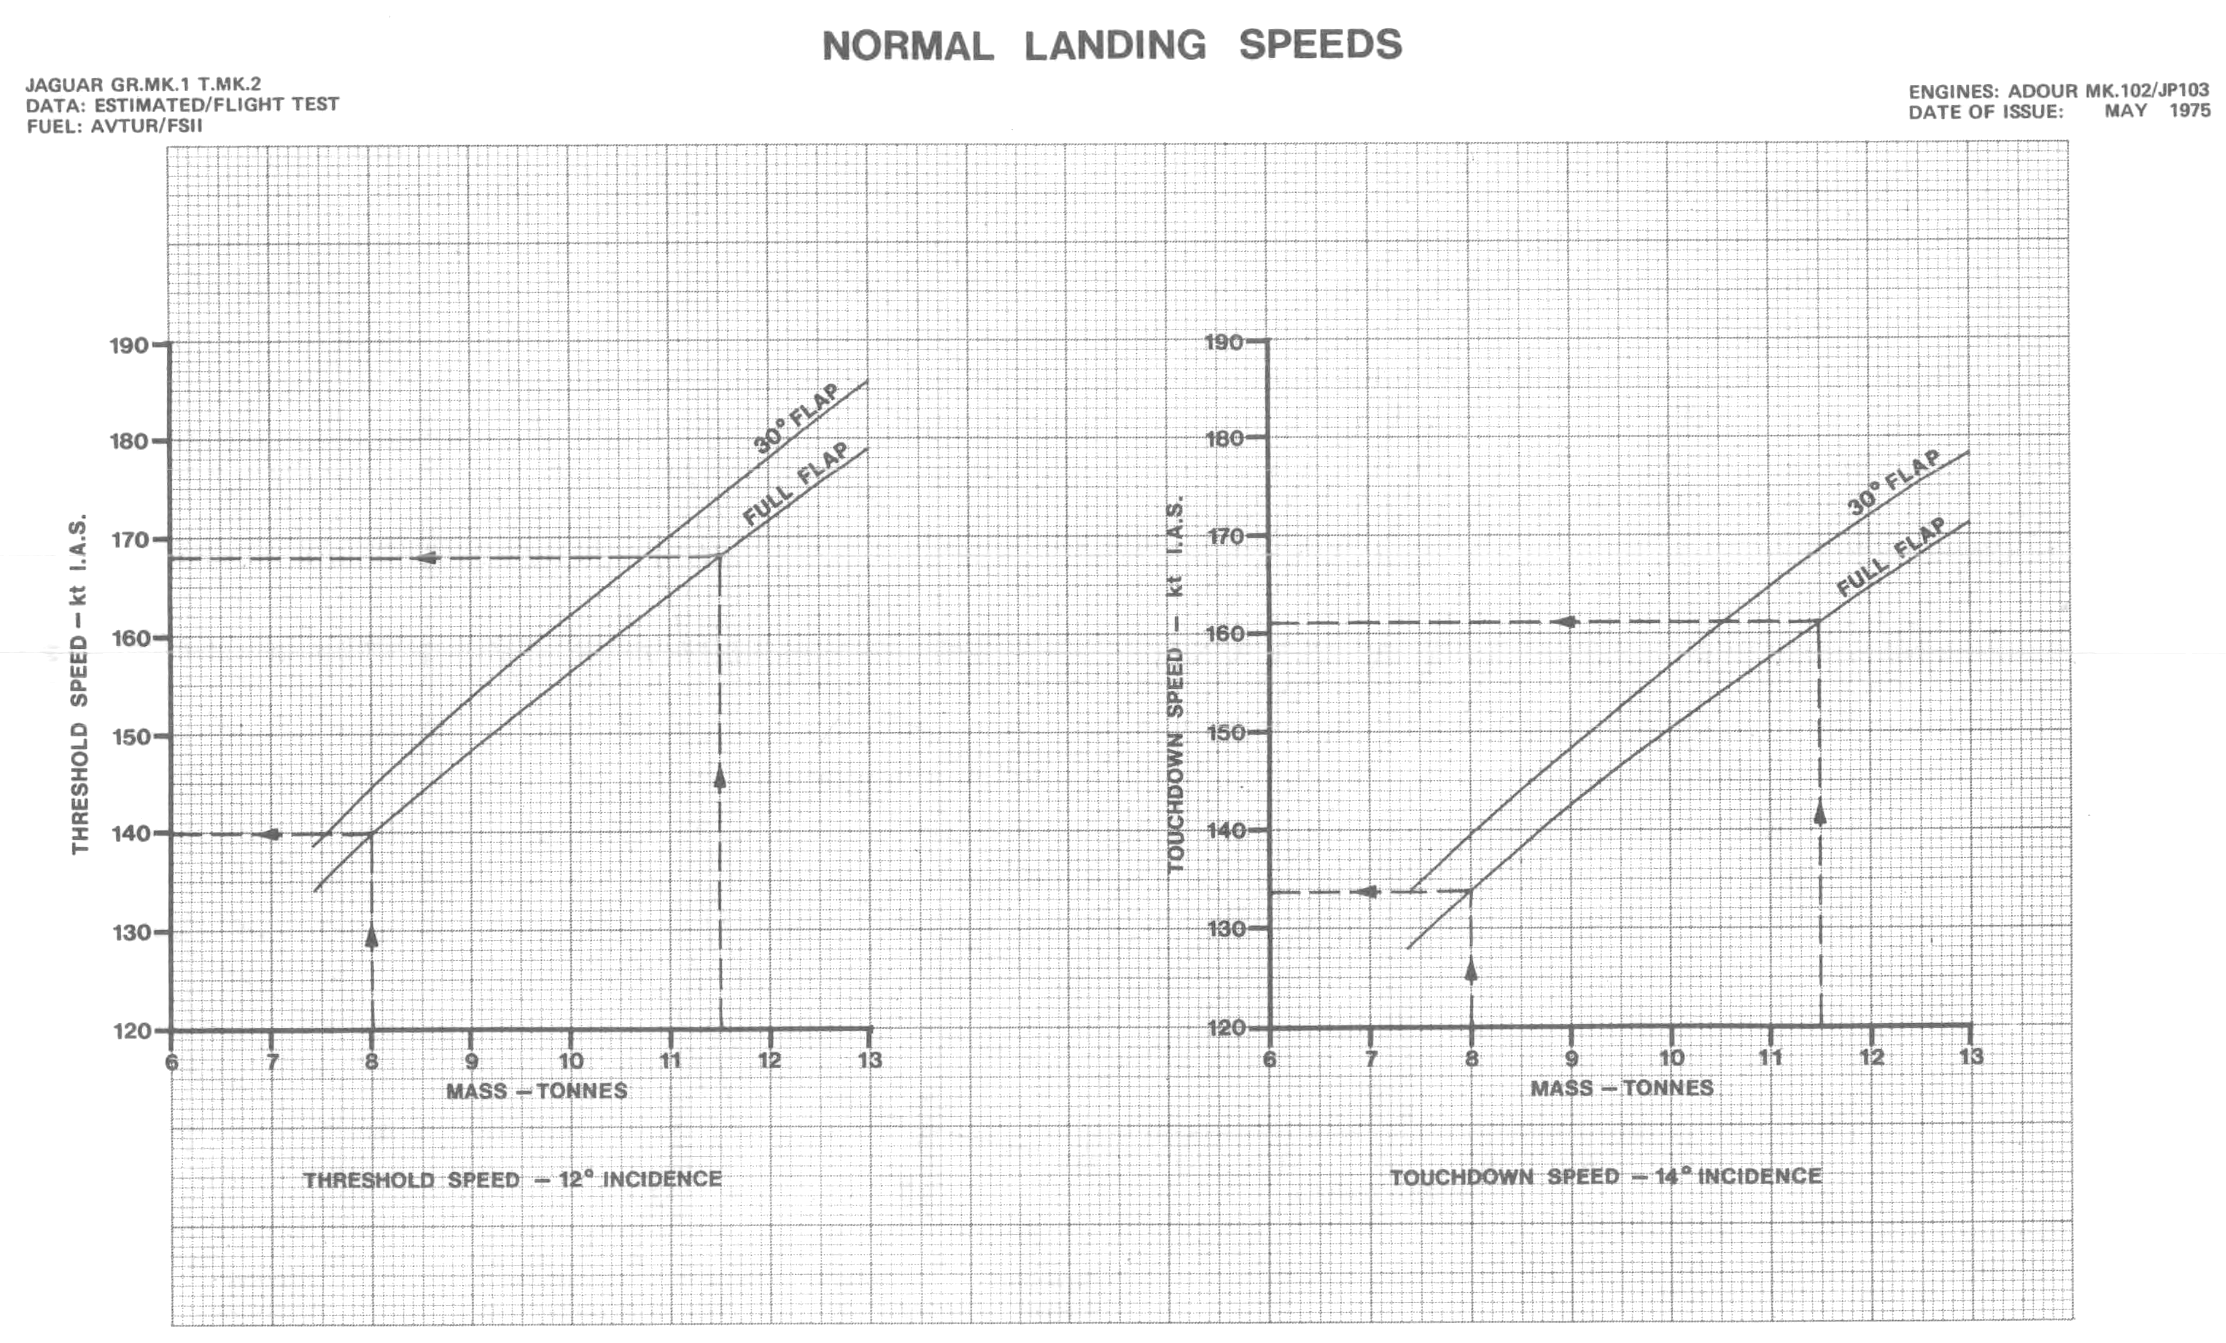
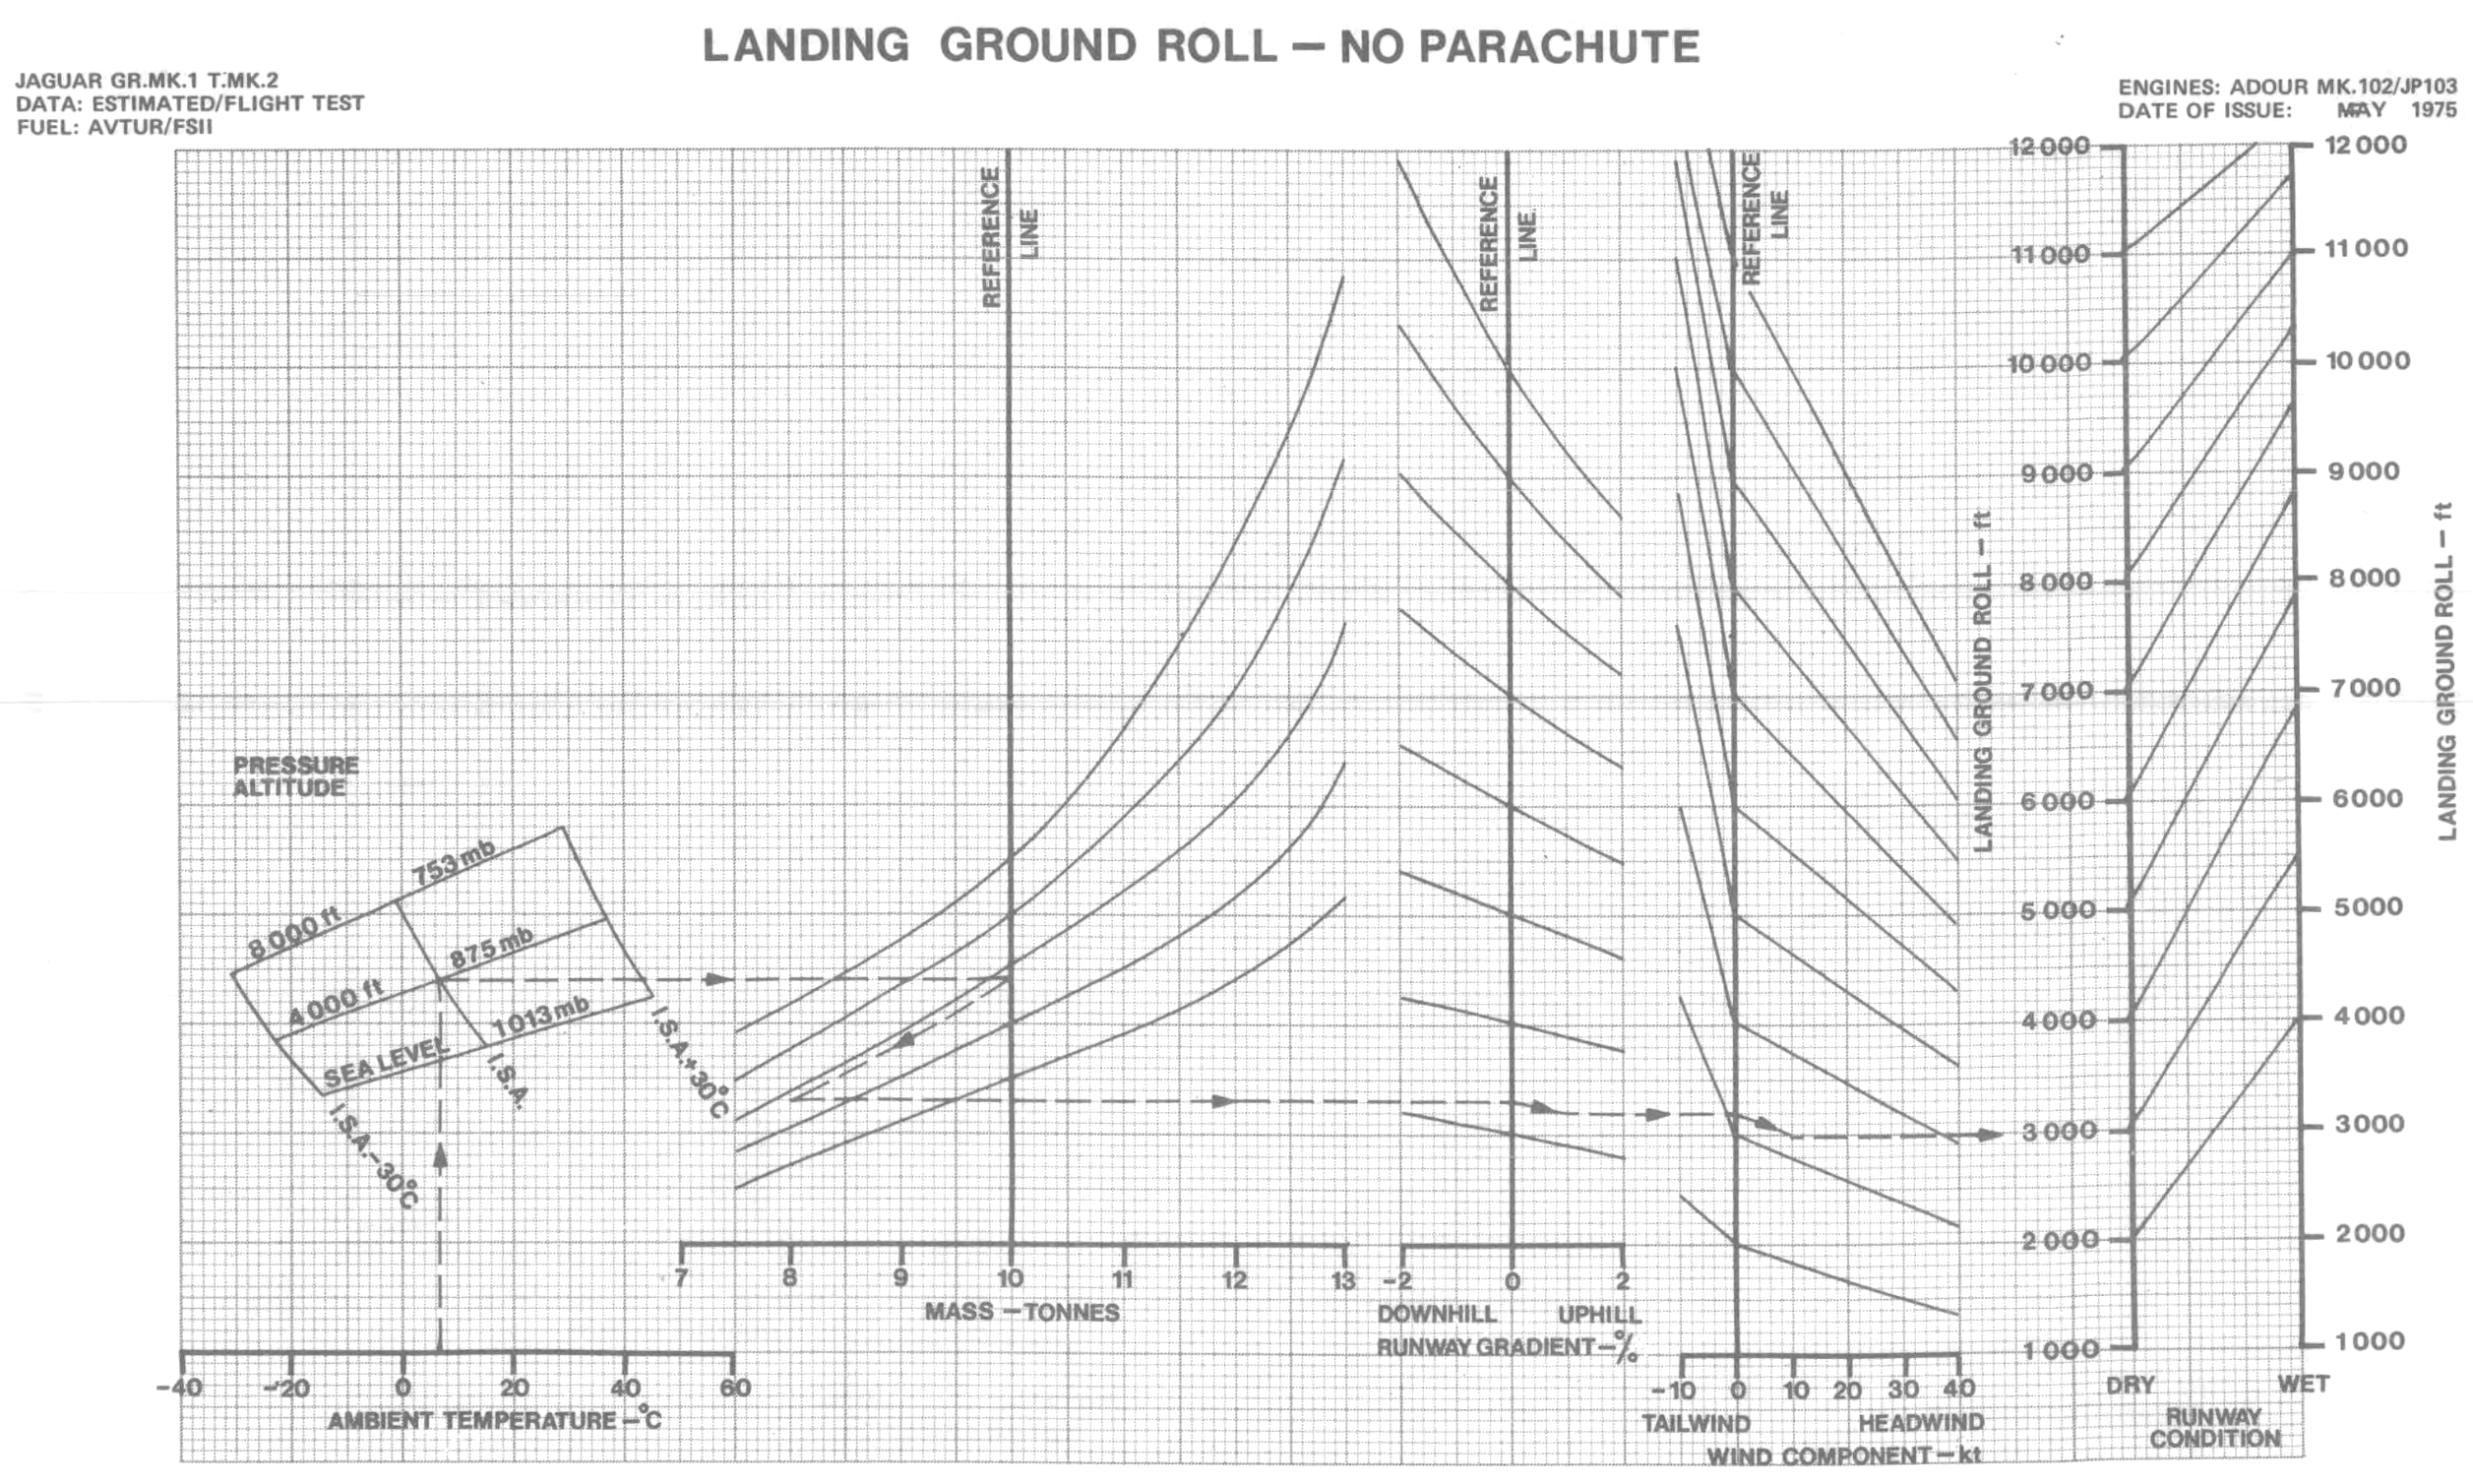
Landing
The recommended normal landing technique involves a 3 degrees glideslope at 12 degrees incidence, aiming to touch down at a sink rate of 100 ft/min.
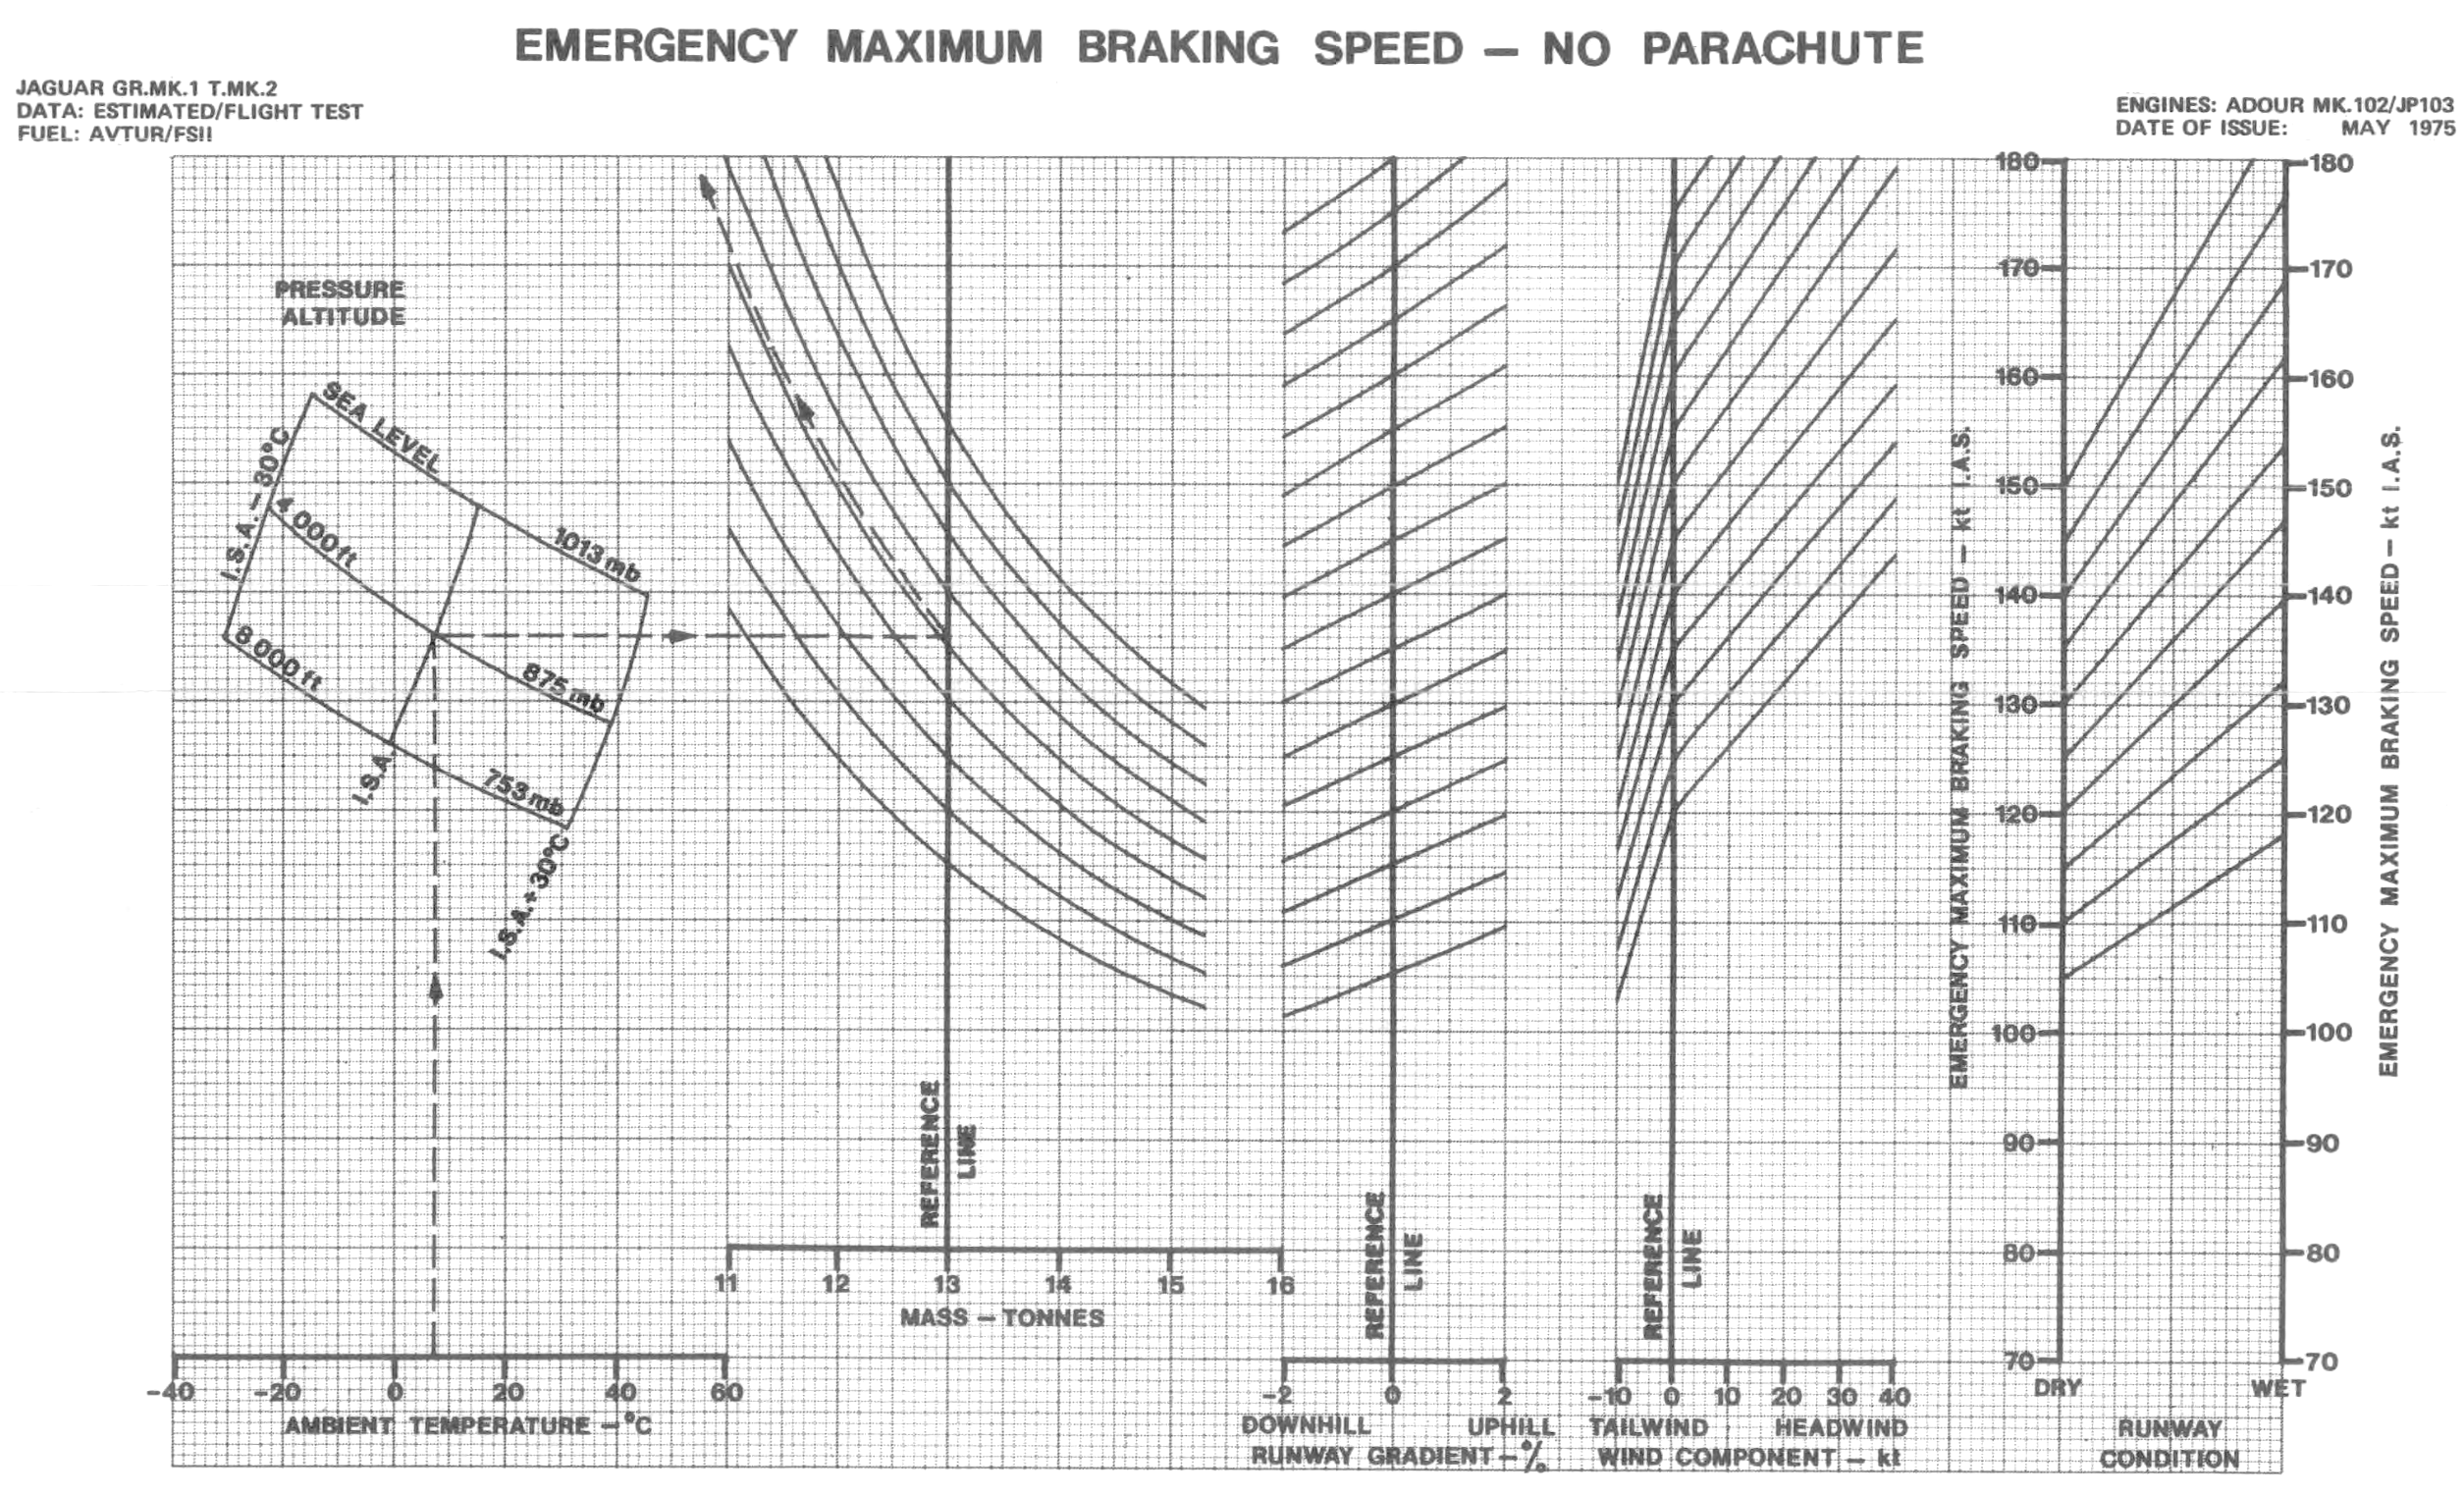
The nose wheel is lowered onto the runway 2 seconds after the main wheels. Wheel braking is applied either at nose wheel touchdown or when speed has reduced to the maximum braking speed.